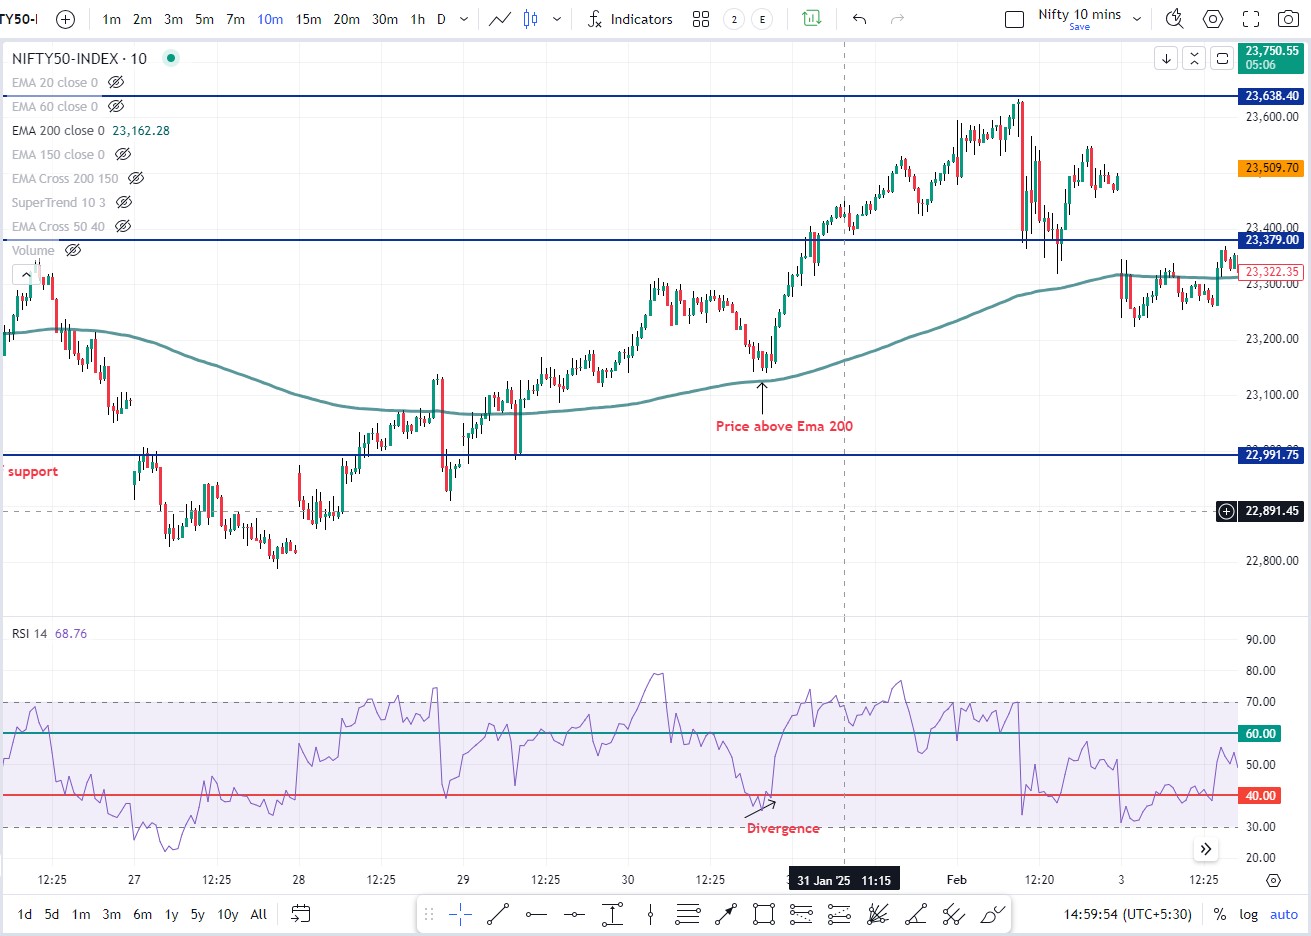
Scenario 1 — Price above EMA 200 & RSI above 40
Higher Timeframe (PT)
- Price above EMA-200 in GPT and PT
- RSI above 40 or bounce from 40
- Look for RSI strength or divergence
Entry Timeframe (CT)
- In CT there should be a bullish crossover
- EMA 200 + trendline support
- SACT / Pitchfan
- S/R price action
- Volume confirmation
- RSI divergence
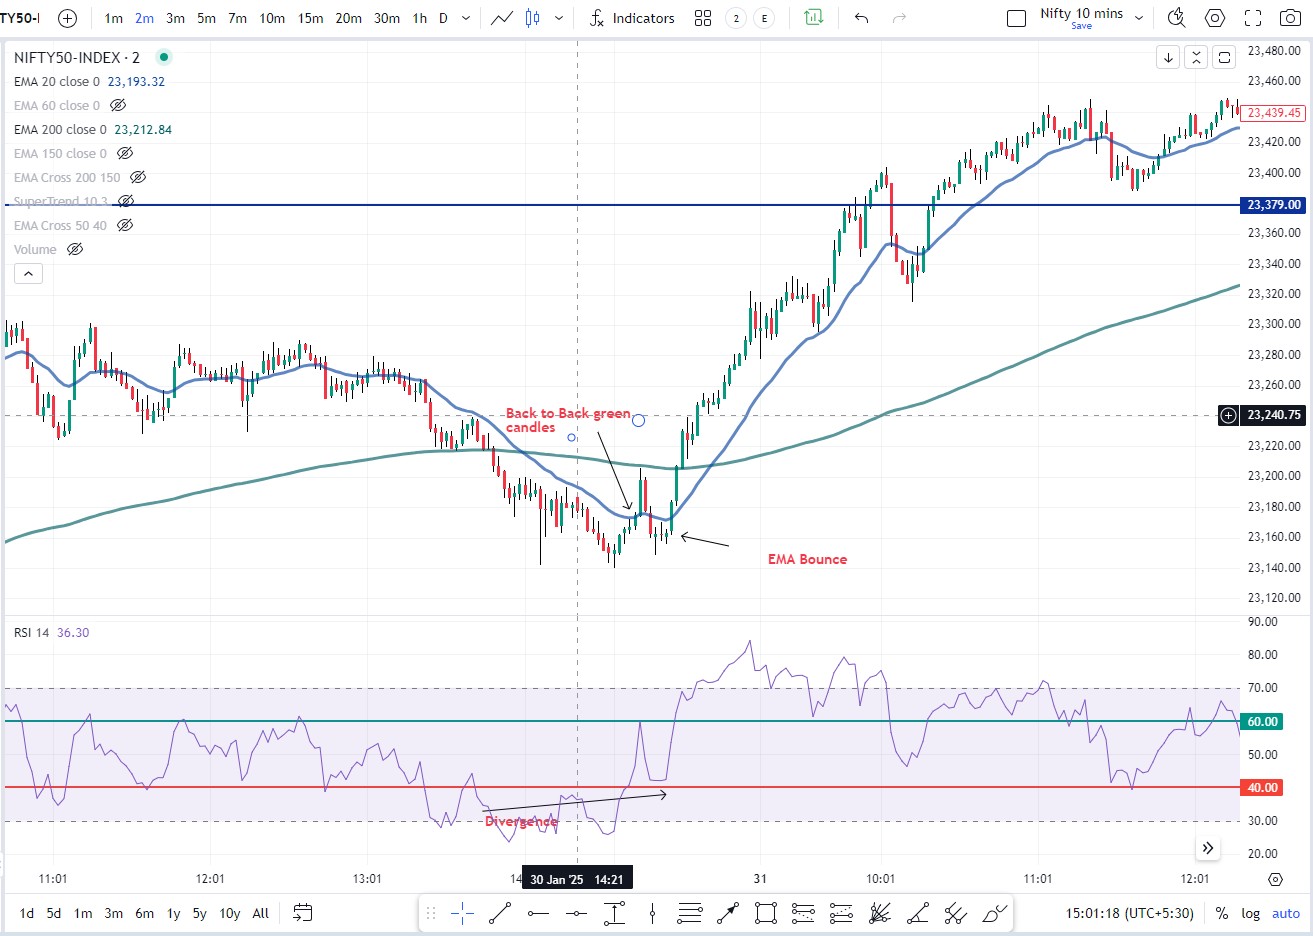
Scenario 2 — Price above EMA 200 & RSI below 40
Higher Timeframe (PT)
- Price above EMA 200
- RSI divergence present
- Wait for price support or RSI strength/divergence
- After price takes support, wait for RSI strength
Entry Timeframe (CT)
- EMA 200 + trendline support
- SACT
- S/R Price action
- Volume
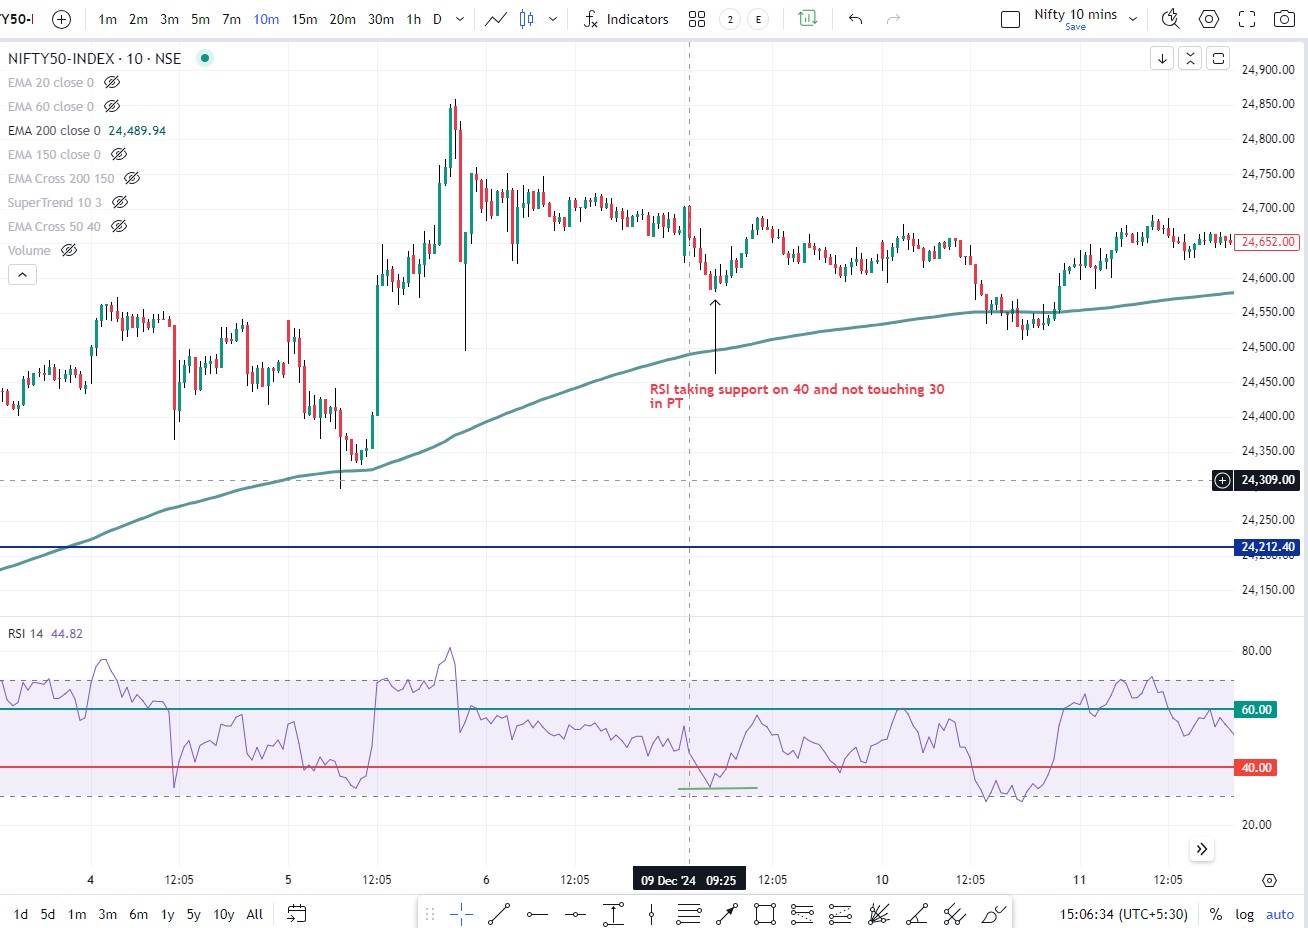
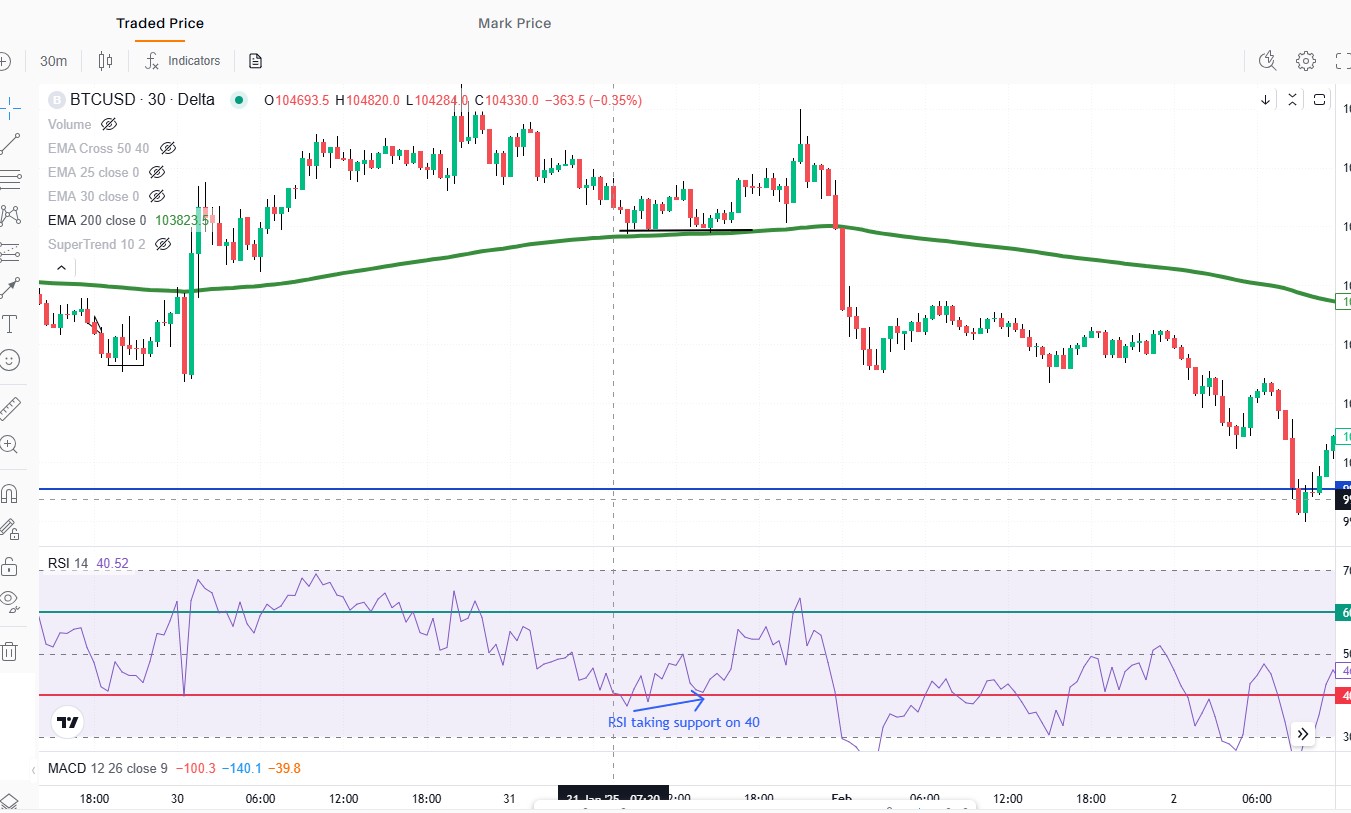
Scenario 3 — W Pattern on RSI 40
Higher Timeframe (PT)
- Price above EMA-200 and not touching it (buyers strong)
- RSI support near 40 and does not reach 30
- Look for RSI divergence
- MACD bullish crossover present
- Avoid entry if candle range is small
- Target = recent resistance (quick exit may be needed)
Entry Timeframe (CT)
- Double bottom formation
- EMA-200 + trendline
- Clear bullish price action
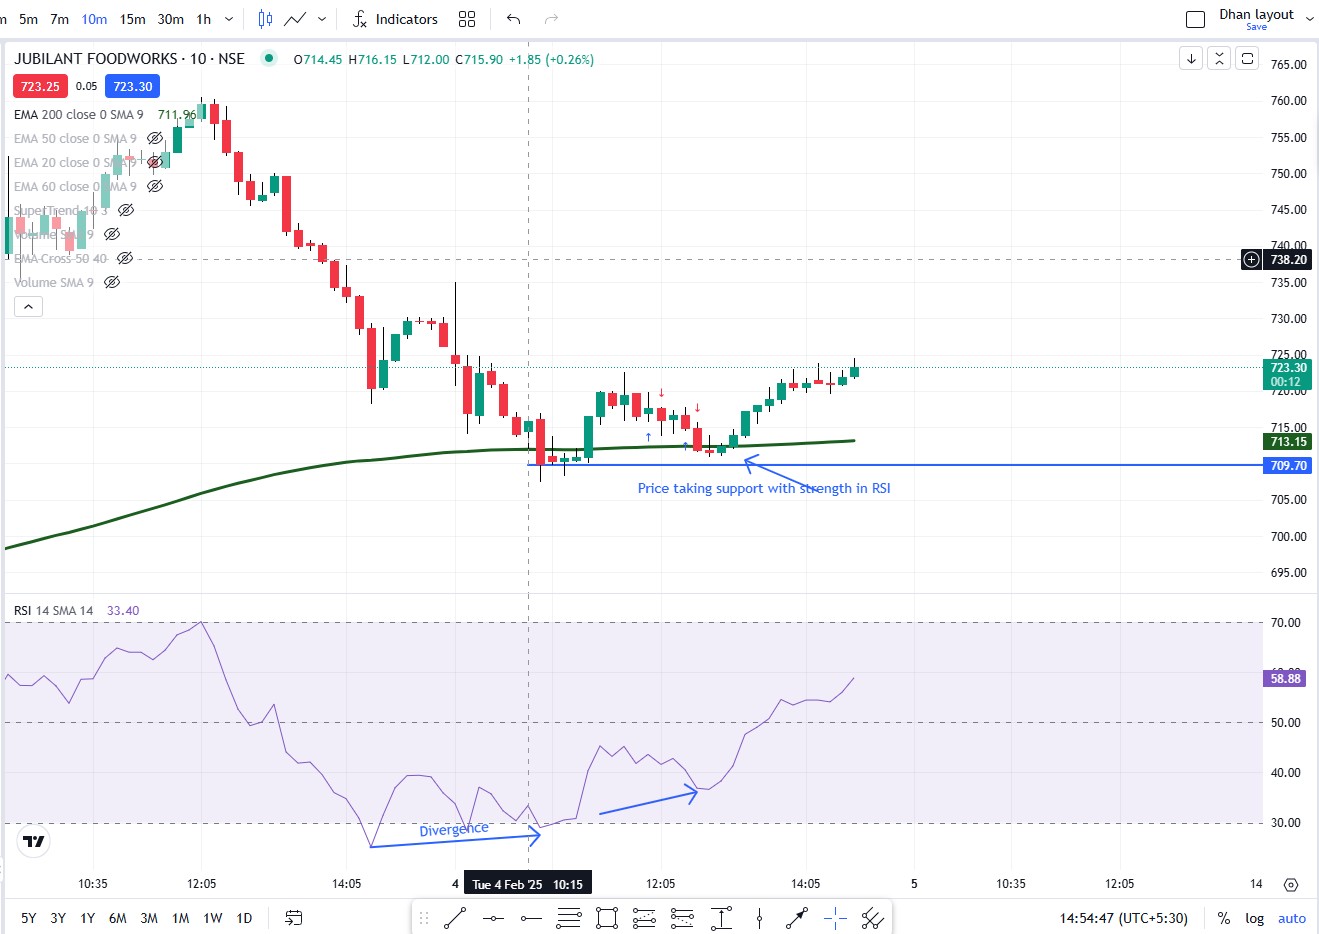
Examples
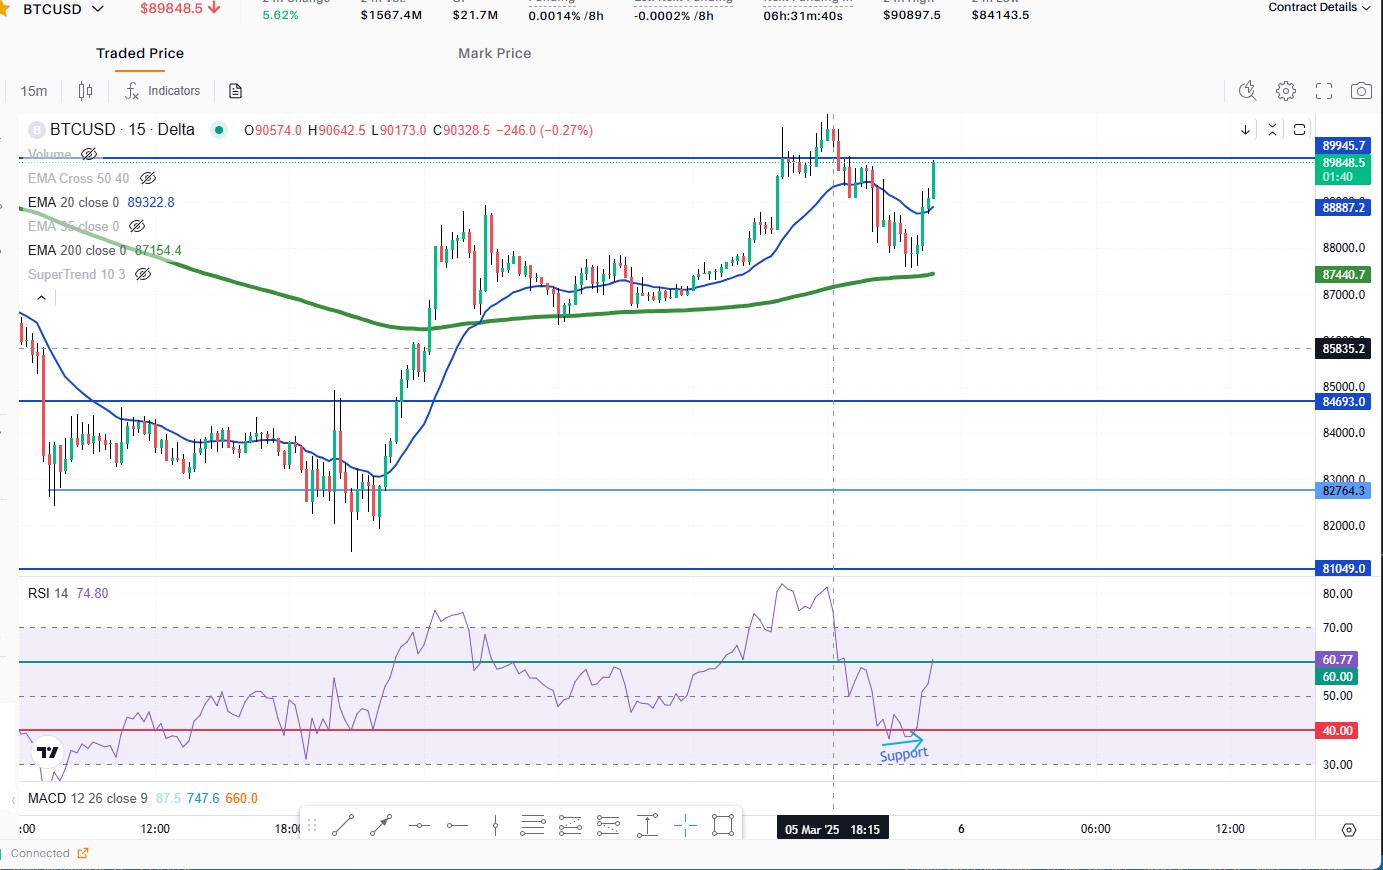
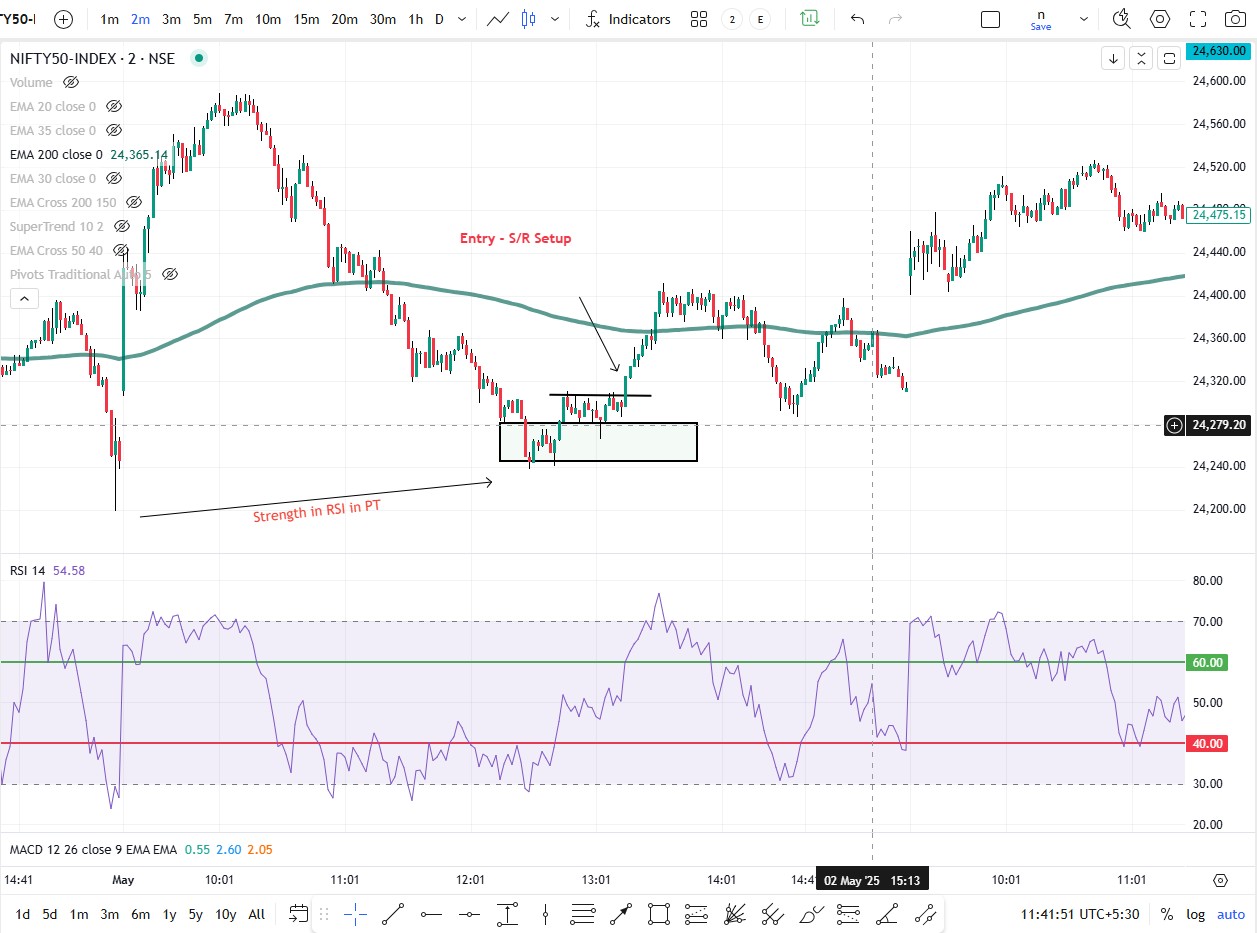
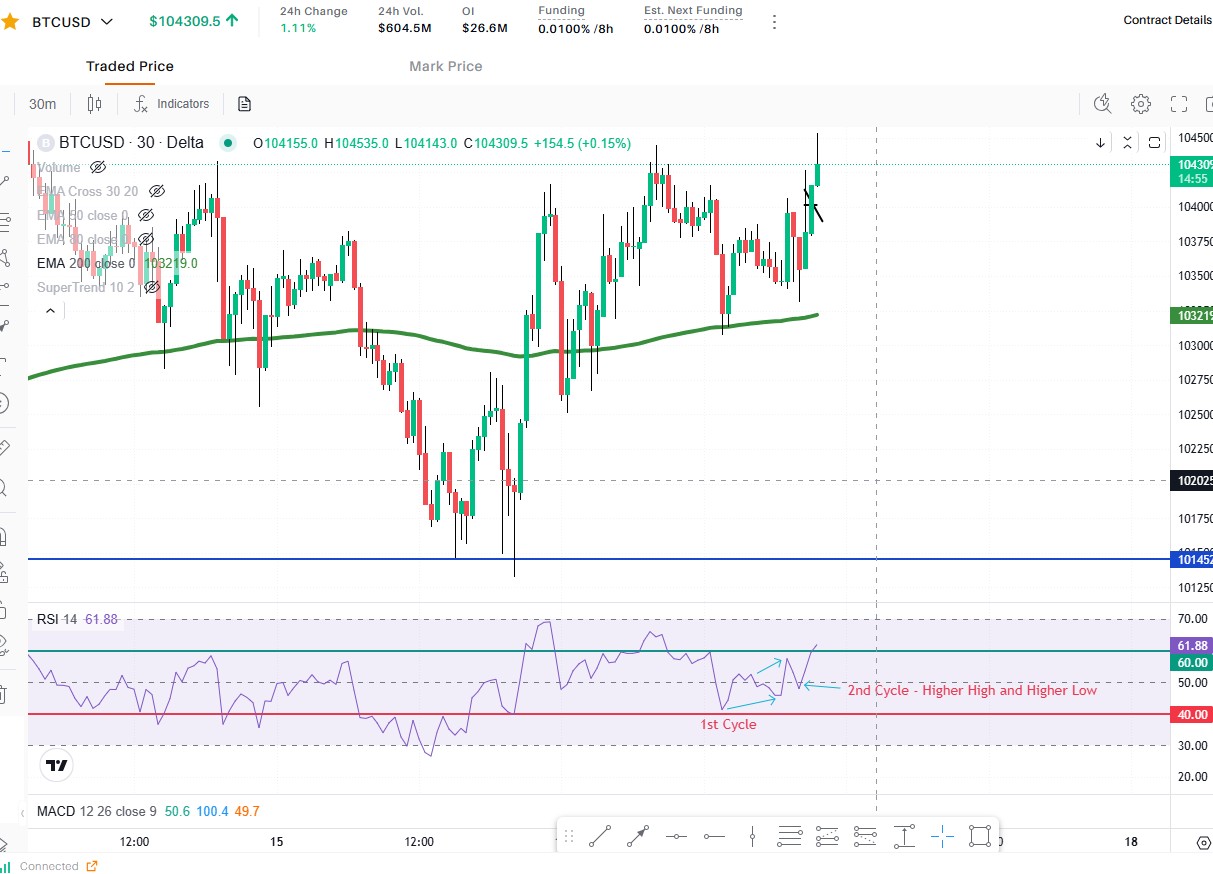
Scenario 4 — Strength in RSI
Higher Timeframe (PT)
- Price above EMA-200
- RSI strength in first cycle
- Second RSI cycle higher than first
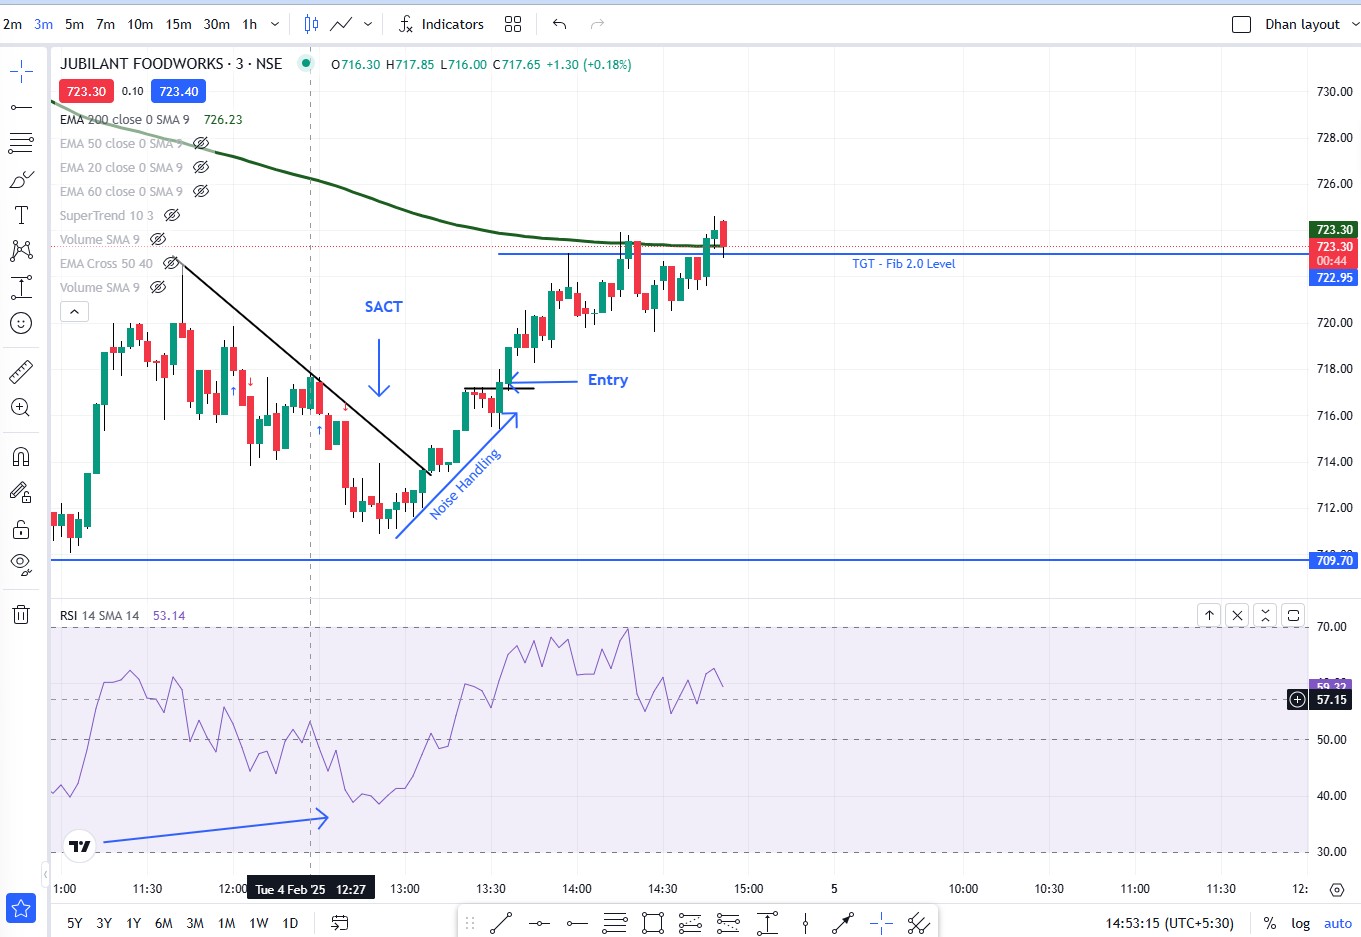
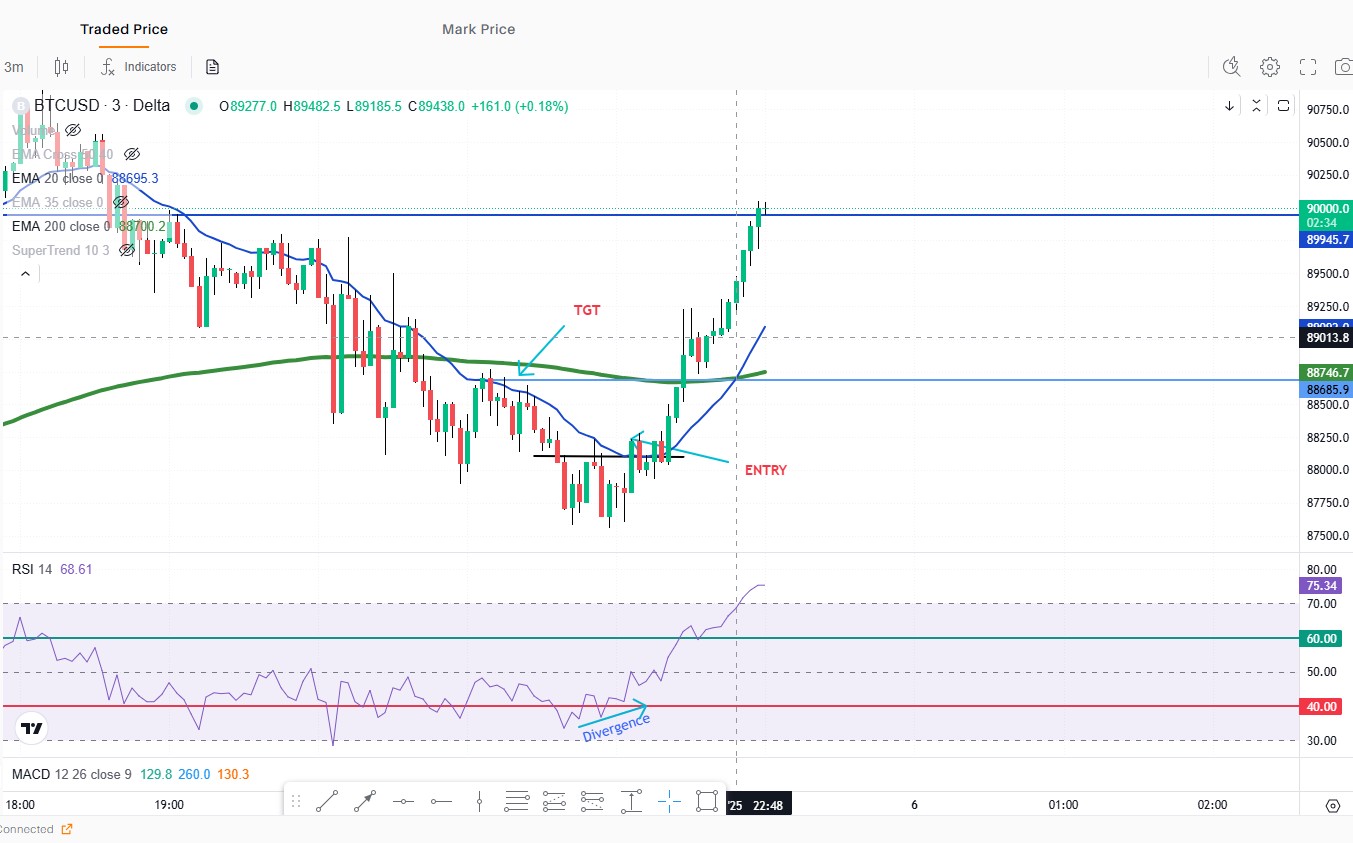
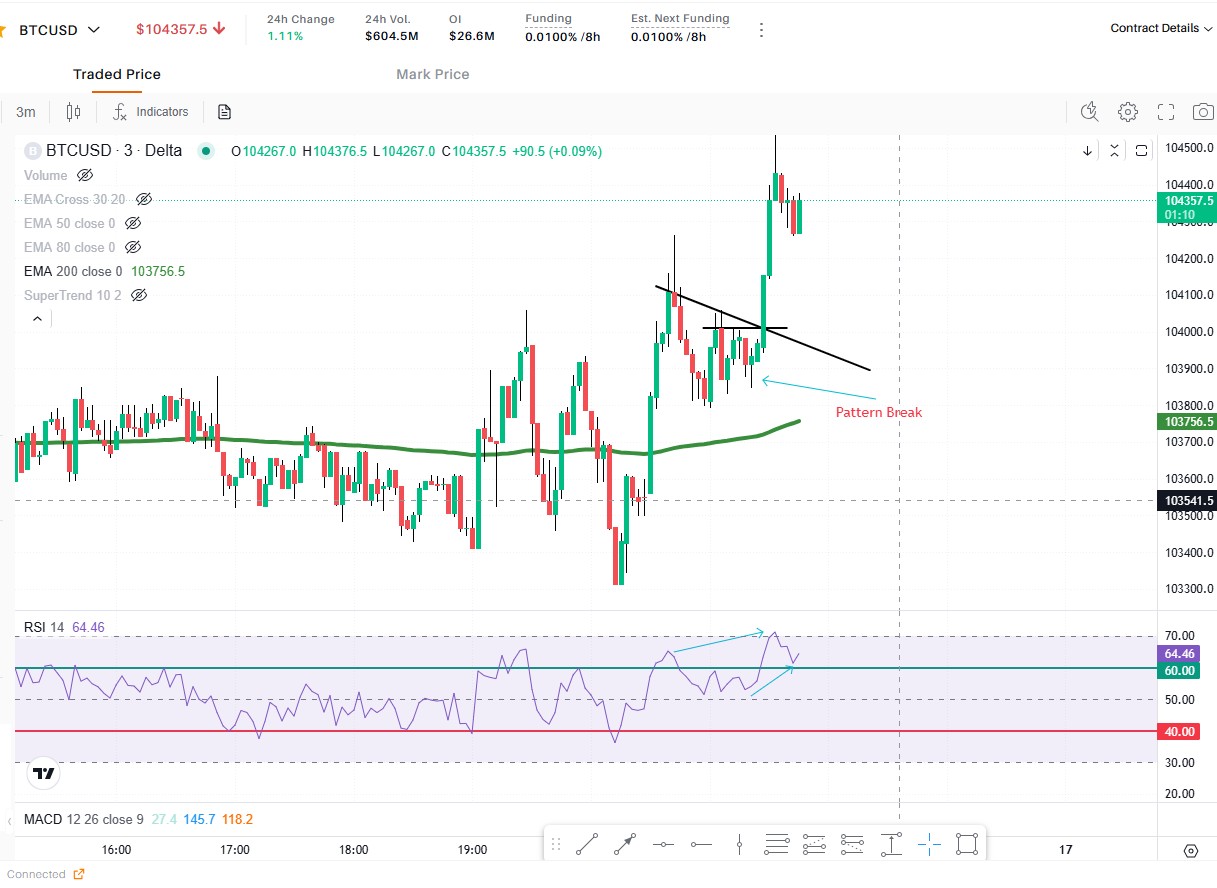
Entry Timeframe (CT)
- EMA-200 + trendline support
- Strong bullish price action
- Support/Resistance breakout
- RSI strength confirmation
- Entry on resistance break
- Patterns above EMA-200 & EMA-50