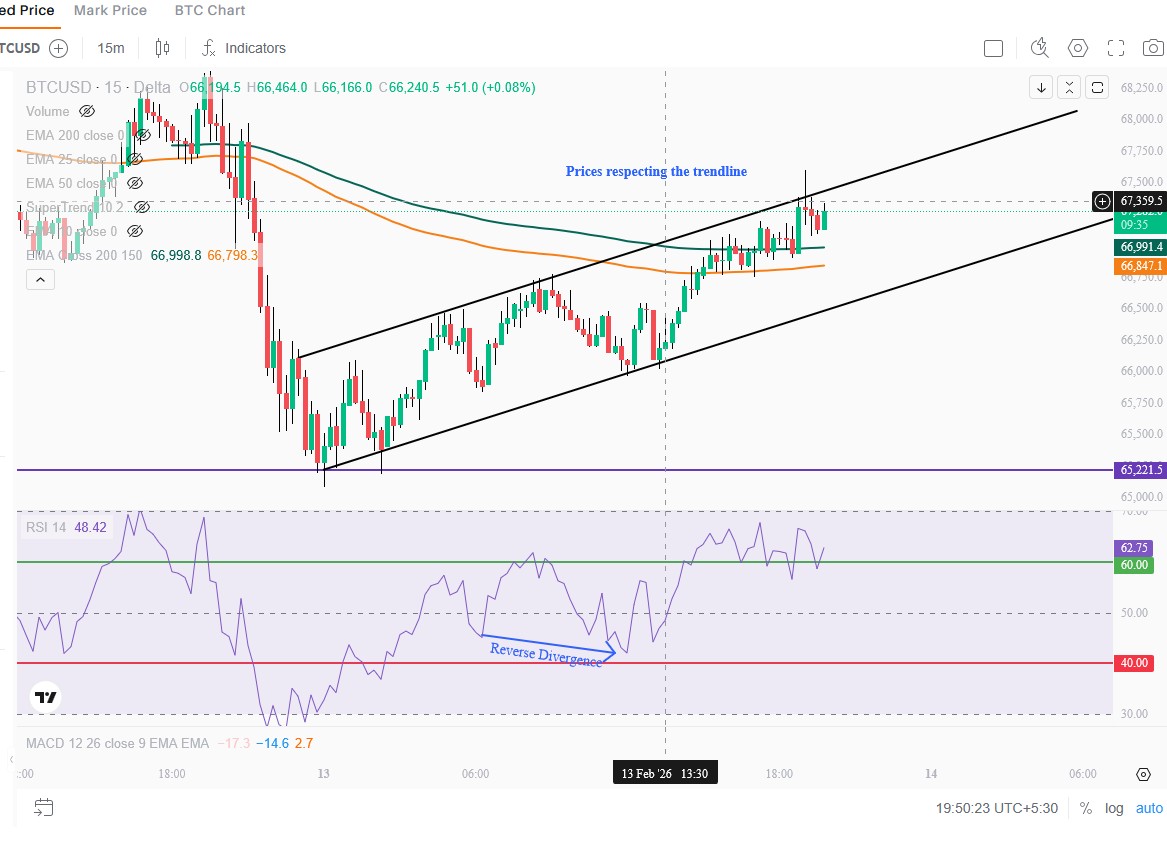
Trendline - Prices Respecting EMA 25/50
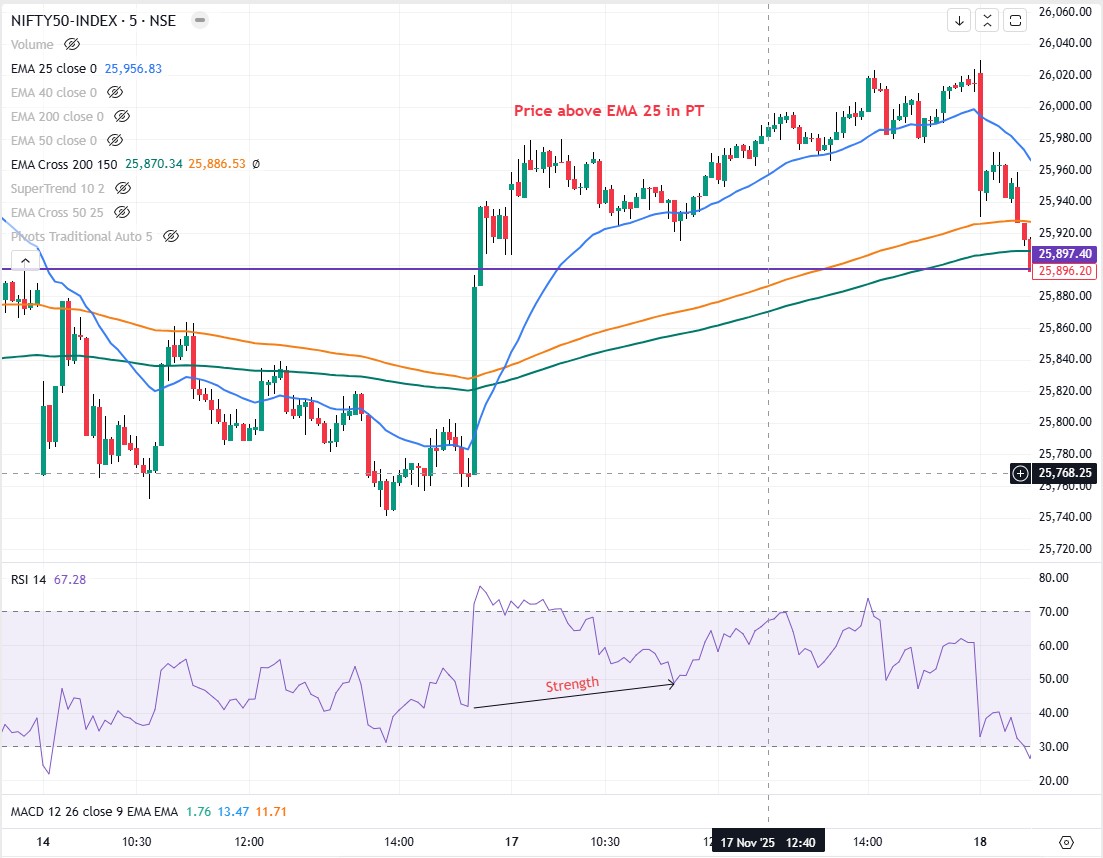
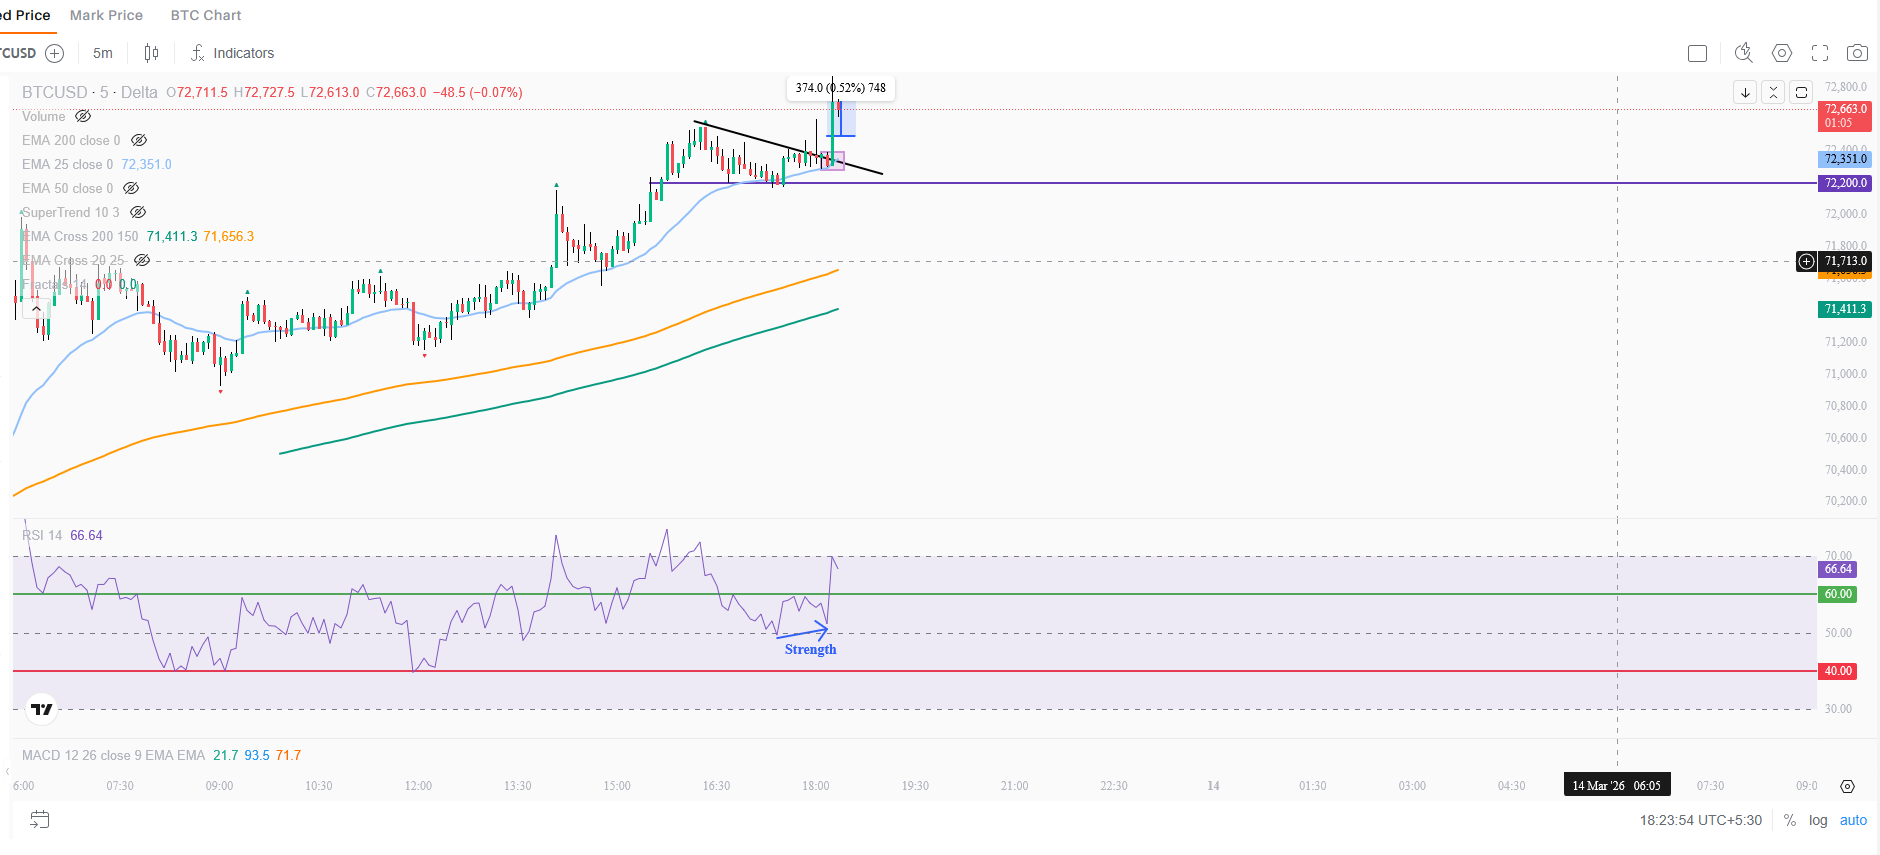
Higher Timeframe (PT)
- Bullish EMA Cross 150/200 in 15 mins and 5 mins
- Look for RSI strength or divergence in 5 mins
- Prices should be above 25 and 50 EMA
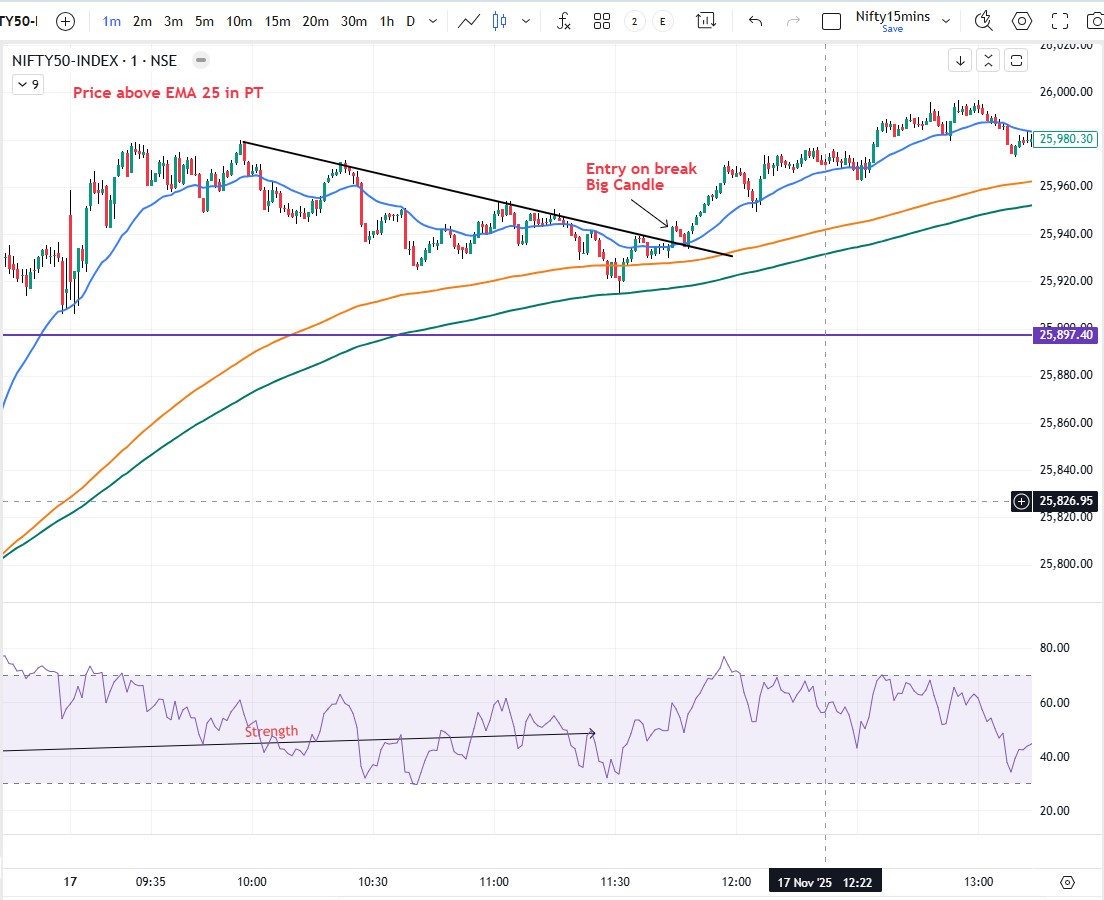
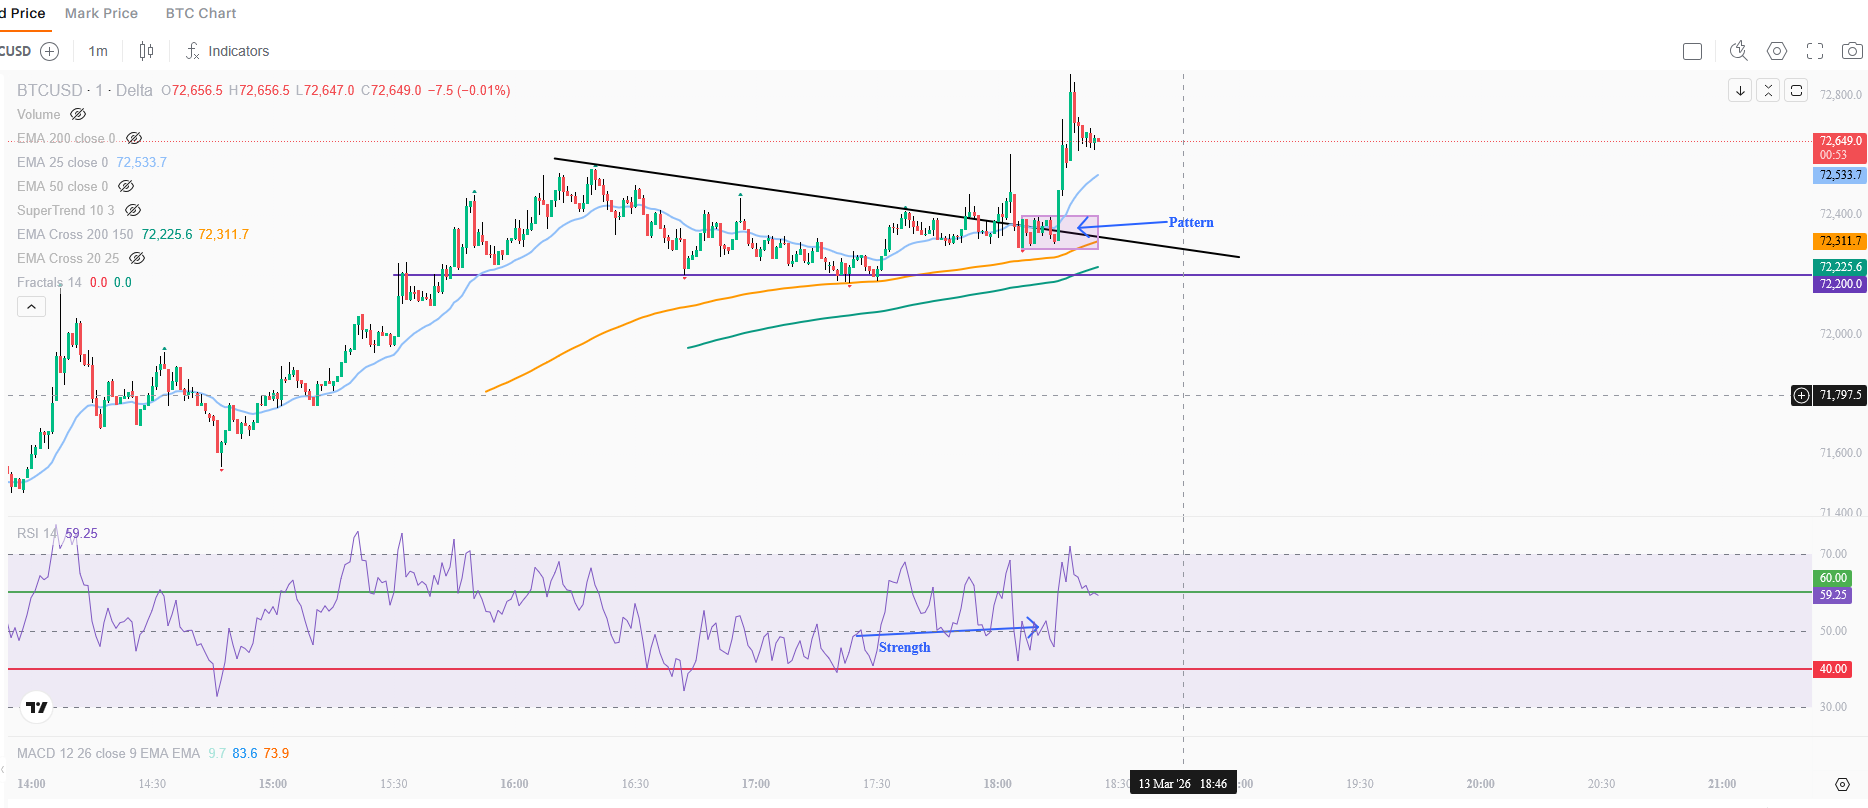
Entry Timeframe (CT)
- Draw Trendline - trendline break and pattern formation should be below EMA 200(Bullish crossover)
- SACT / Pitchfan
- S/R price action
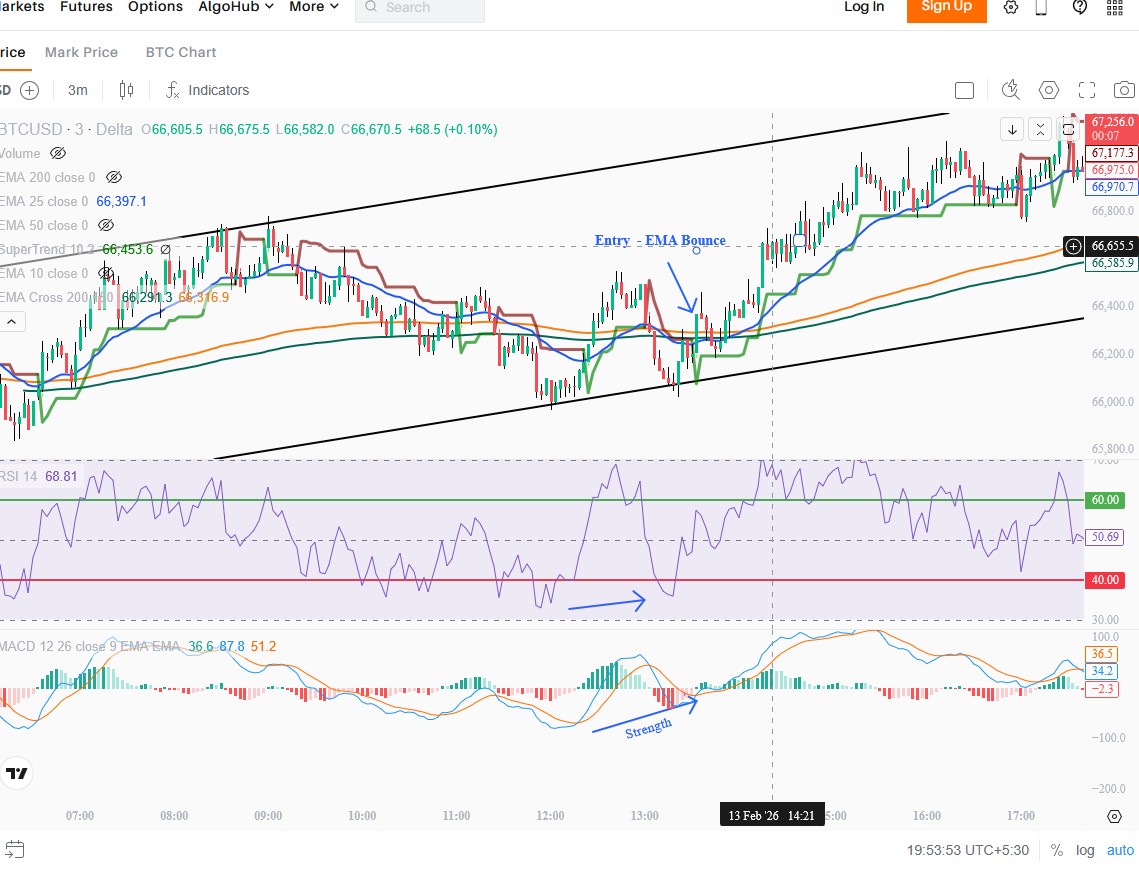
Trendline - Price Bouncing Back above EMA 25/50
Higher Timeframe (PT)
- Bullish EMA Cross 150/200 in 15 mins and 5 mins
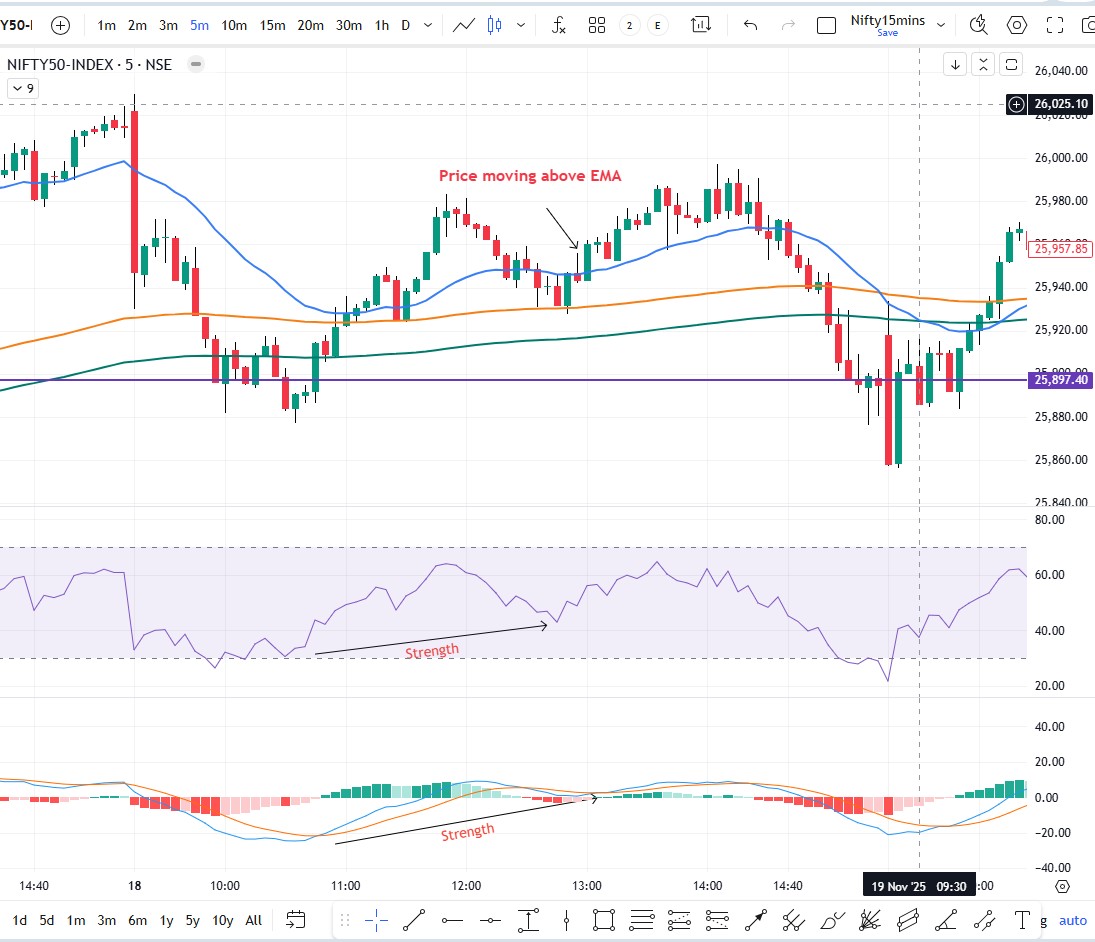
- Look for RSI strength or divergence in 5 mins
- Optional - look for MACD strength
- Prices should bounce above 25 and 50 EMA(EMA BOUNCE)
Entry Timeframe (CT)
- Draw Trendline
- SACT / Pitchfan
- S/R price action
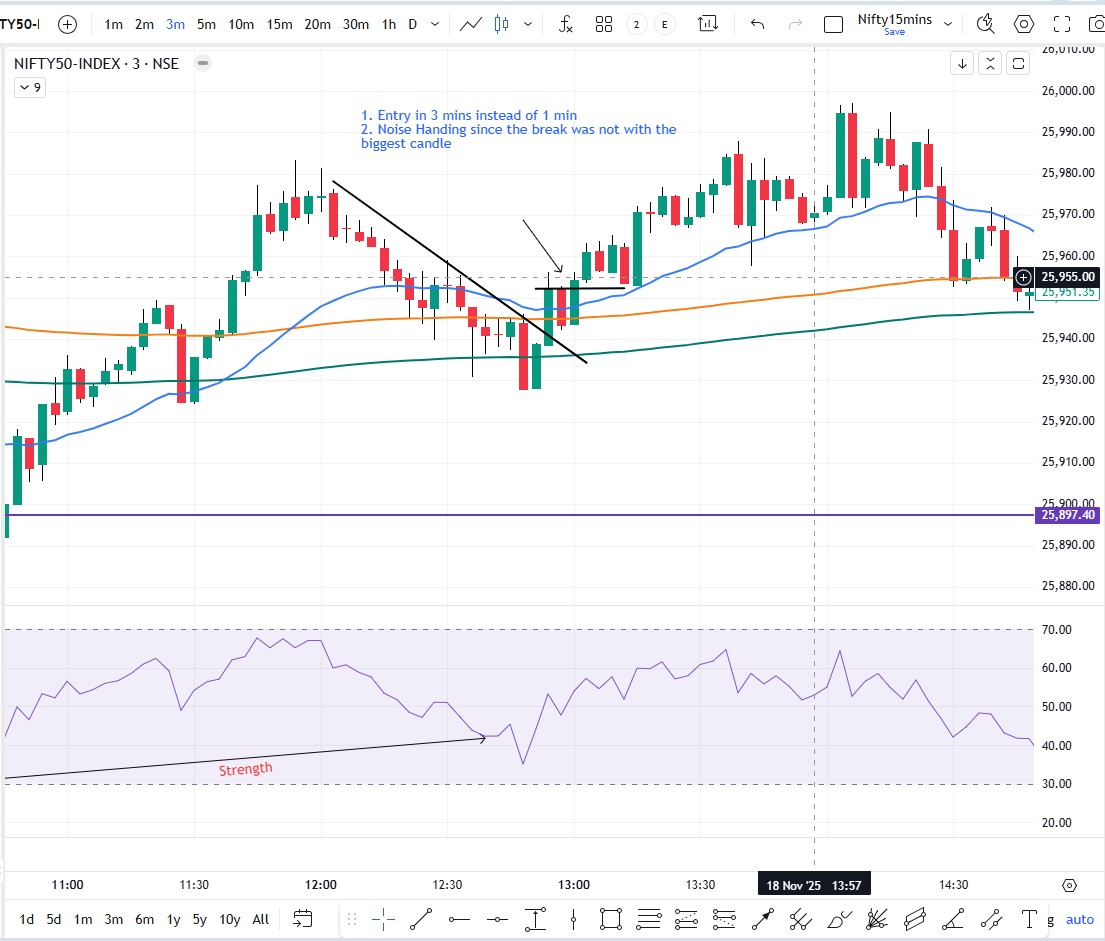
- Important - Wait for pattern break or Retrace break with big candle
Trendline Channel
Higher Timeframe (PT) - 15 mins
- Draw a Tredline after first cycle
- Check if it creates a channel
Entry Timeframe (CT) - 3 mins
- Plan entry when prices touch trendline
- Look for EMA Bounce
- Divergence - W pattern
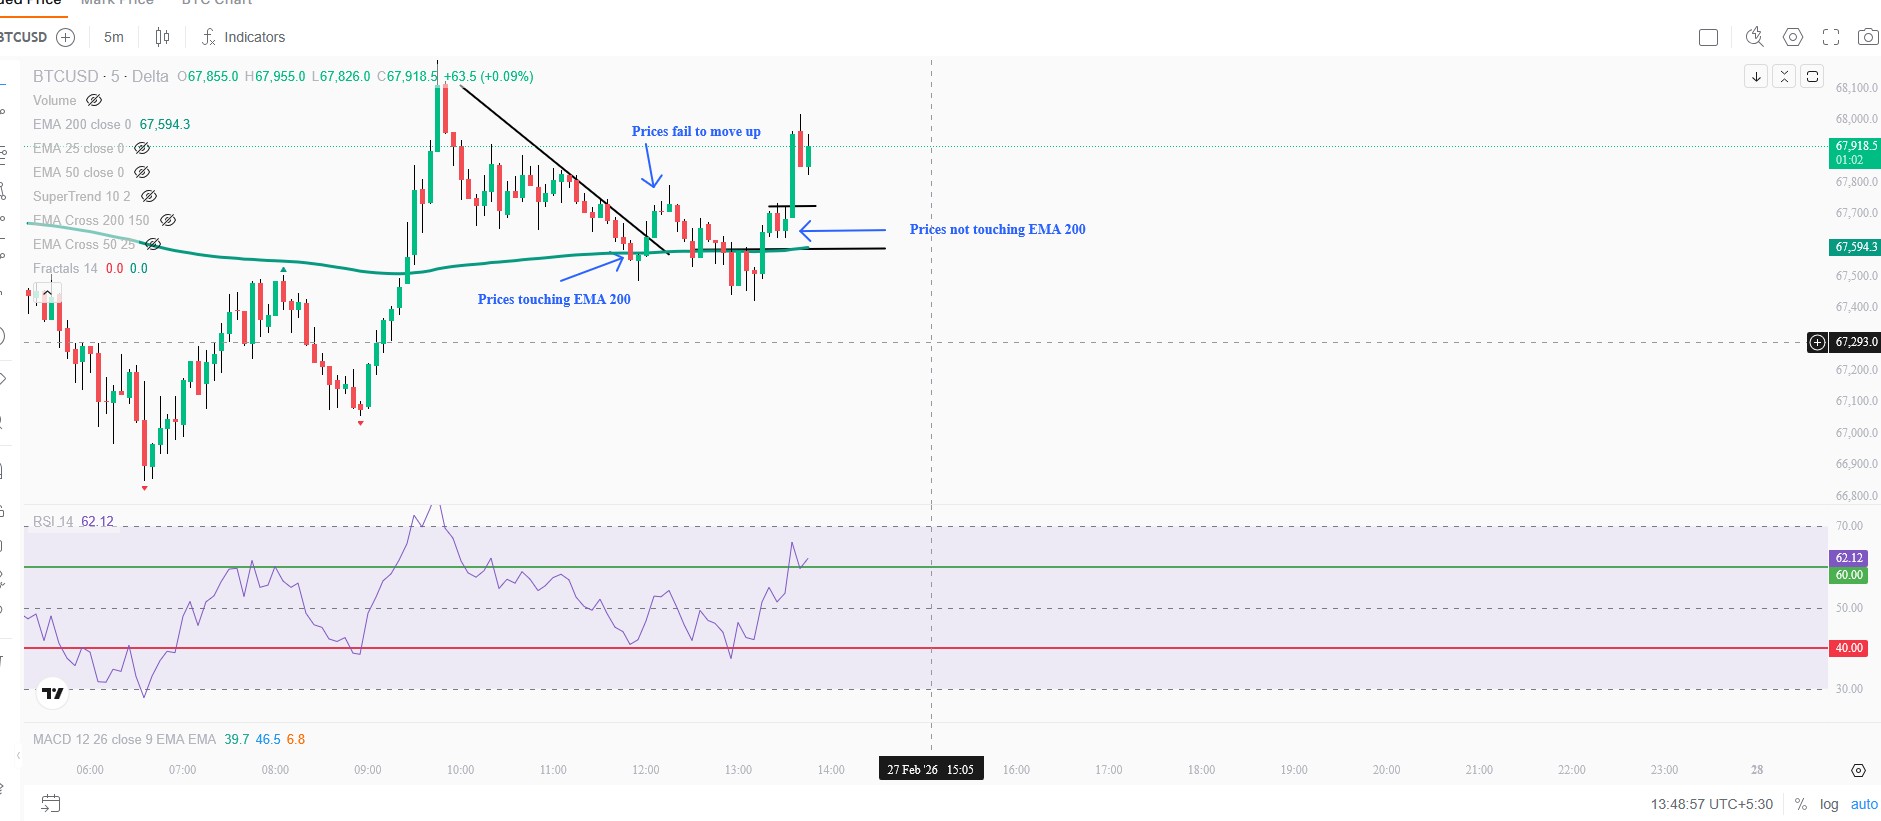
PITCHFAN
Higher Timeframe (PT) - 15 mins
- Prices should not be touching EMA 200
- If Prices are touching EMA 200 wait for next cycle not touching EMA and Strength in RSI
- In Uptrend RSI should exhibit strength and in downtrend RSI should exhibit weakness
- Draw Trendline on RSI and Prices
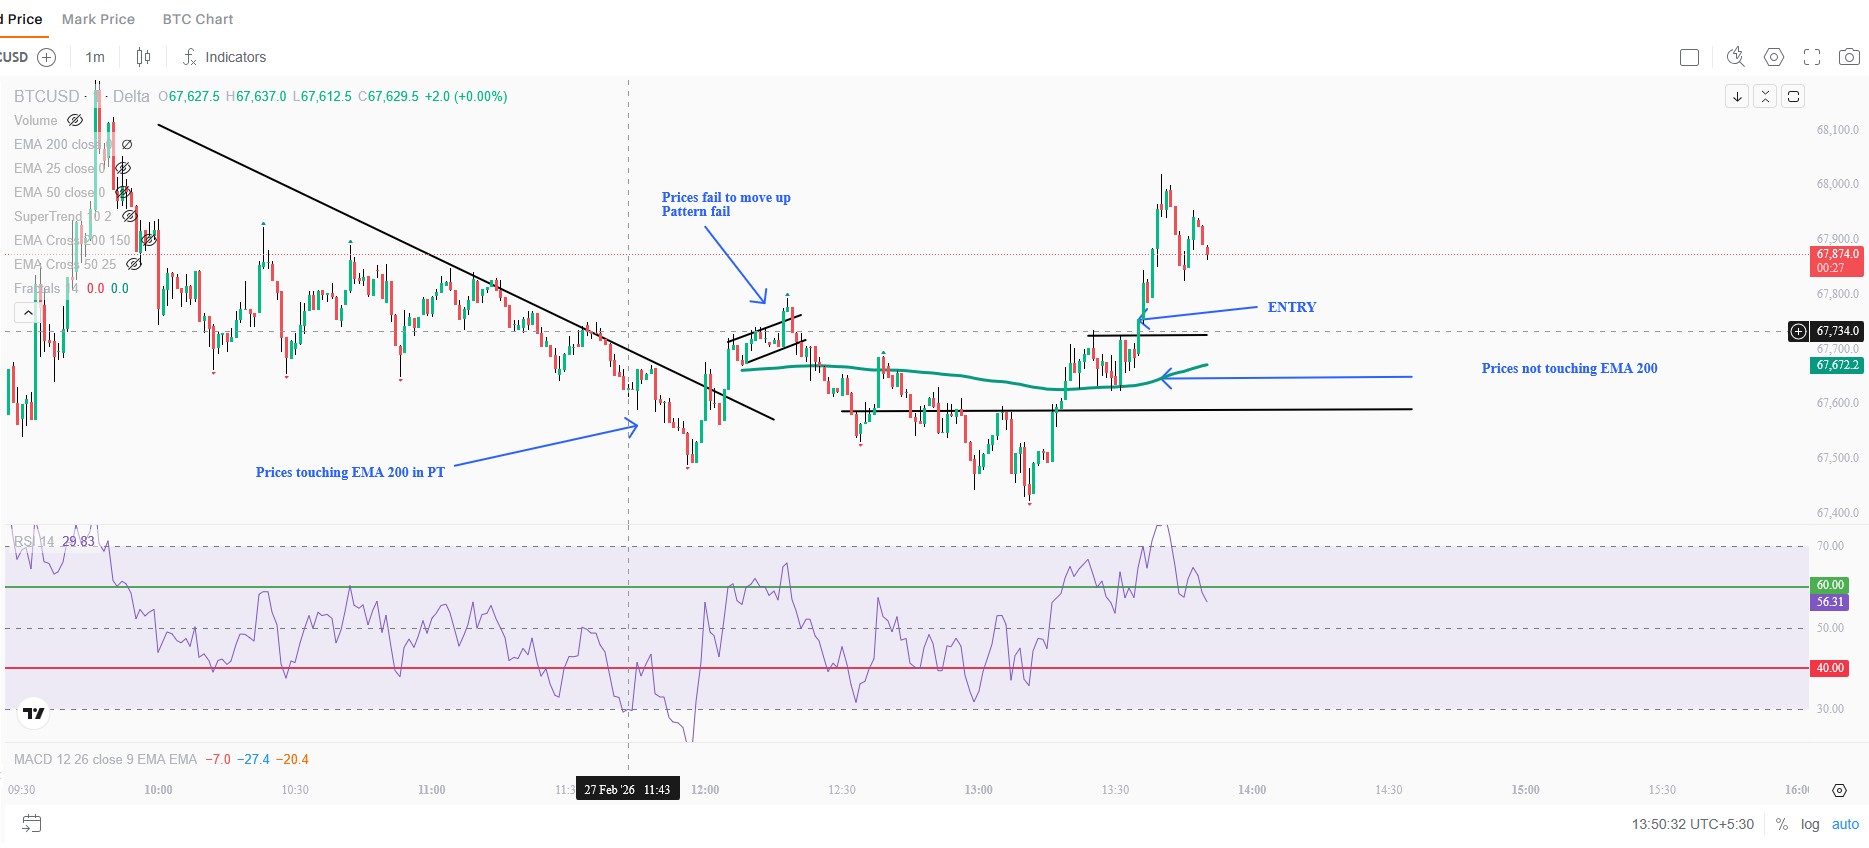
Entry Timeframe (CT) - 3 mins
- Look for a pattern
- Prices should be above Pitchfan 0.5 lvl
- Bullish crossover on EMA 150/200
Example 2 - showing strength in RSI in PT