SACT
Scenario 1: Price above EMA 200 and RSI above 40
- Draw a Trendline in PT
- Prices should be above EMA 200
- Wait for prices to break the trendline in CT
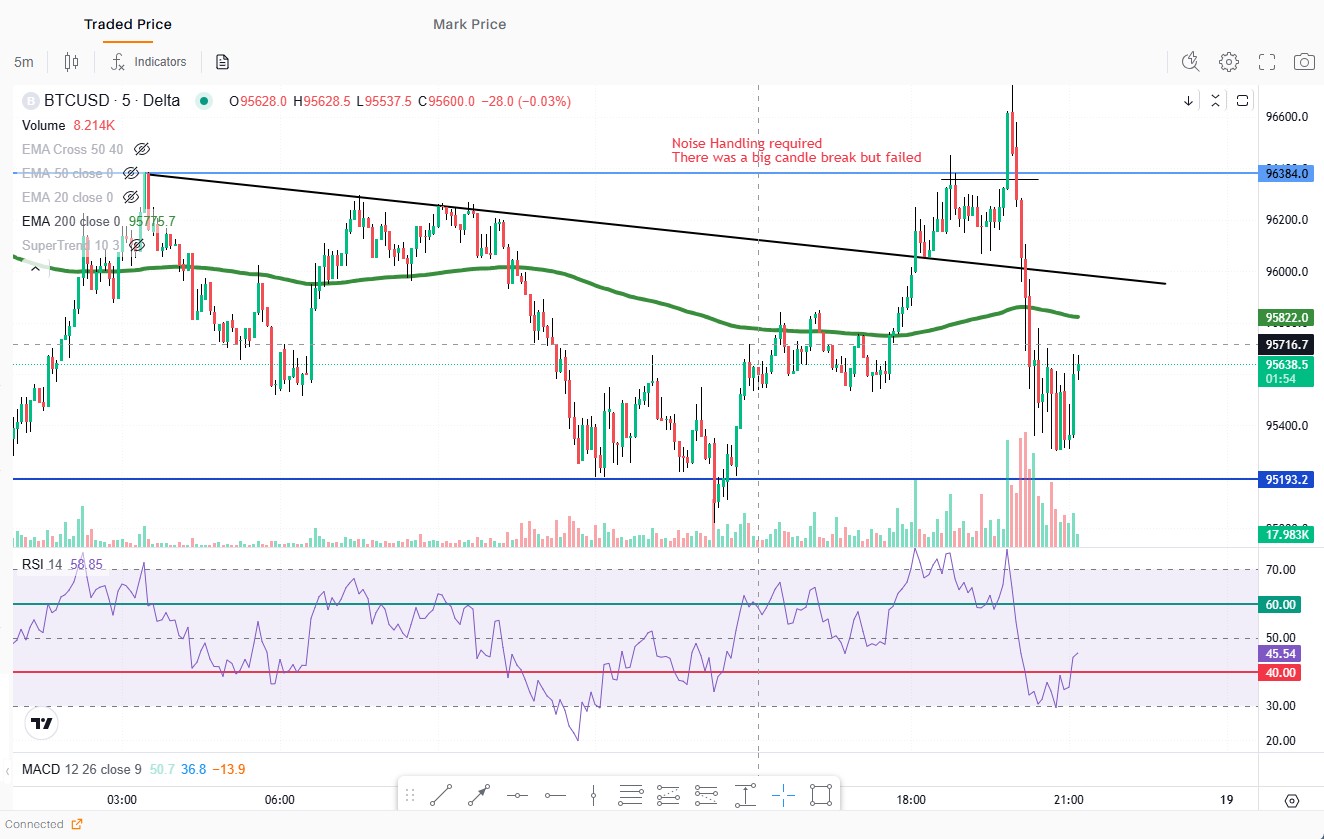
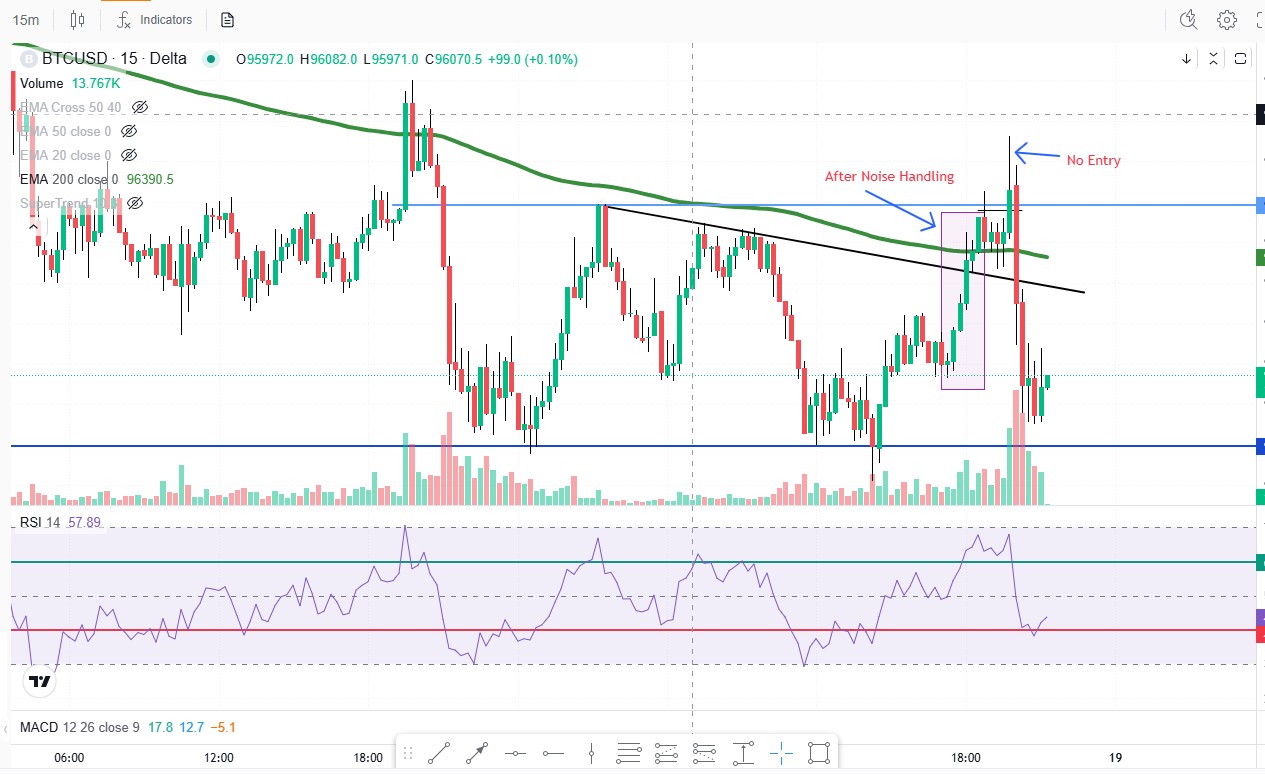
- Make sure to do Noise Handling
- In CT
- EMA 200 + trendline
- SACT
- Price Action
- Volume
- Divergence in CT
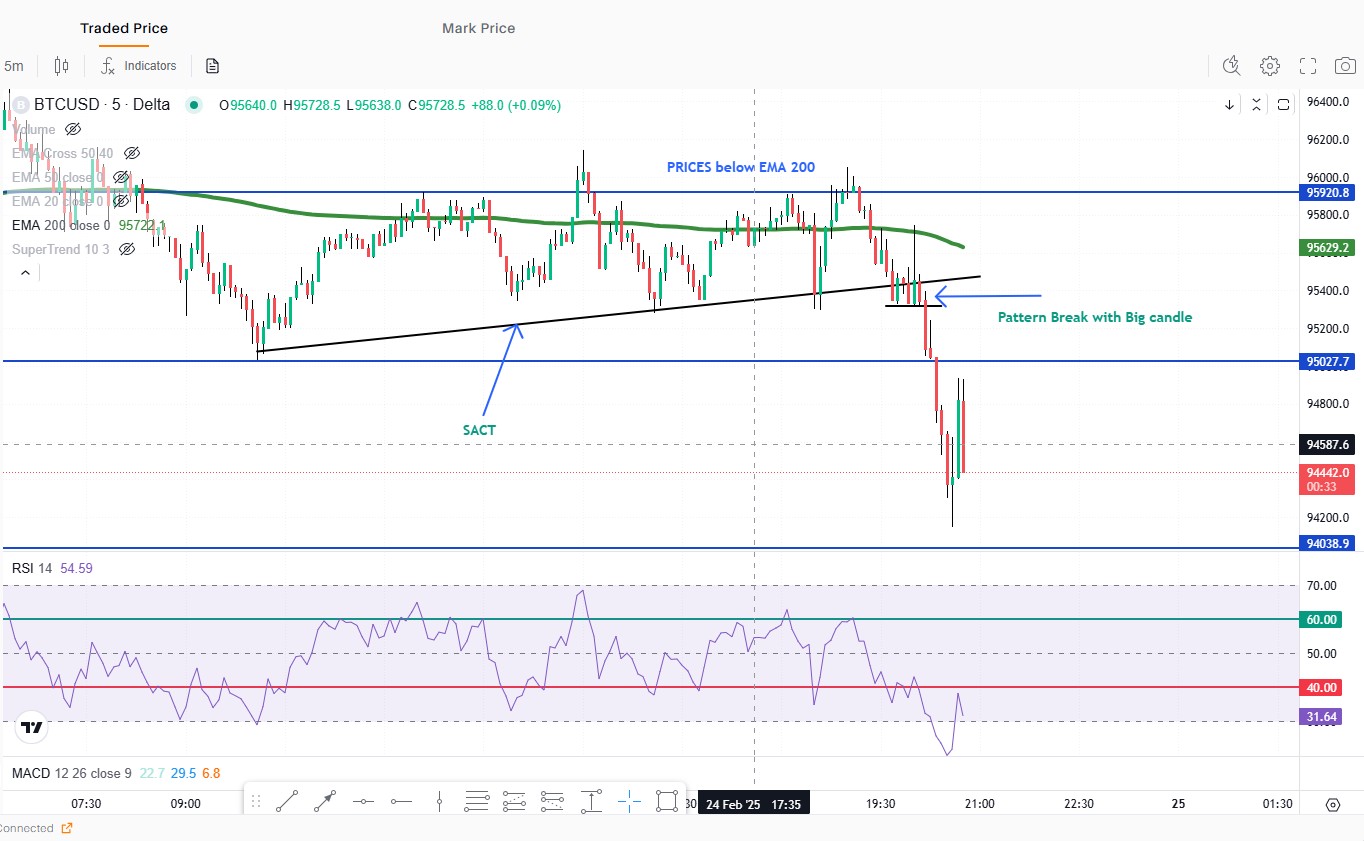
Scenario 2: PATTERN BREAK - EMA 200 and RSI below 60
- Draw a Trendline in PT
- Prices should be below EMA 200
- Wait for prices to break the trendline in CT
- Pattern is formed near trendline
- Make sure to do Noise Handling
- In CT
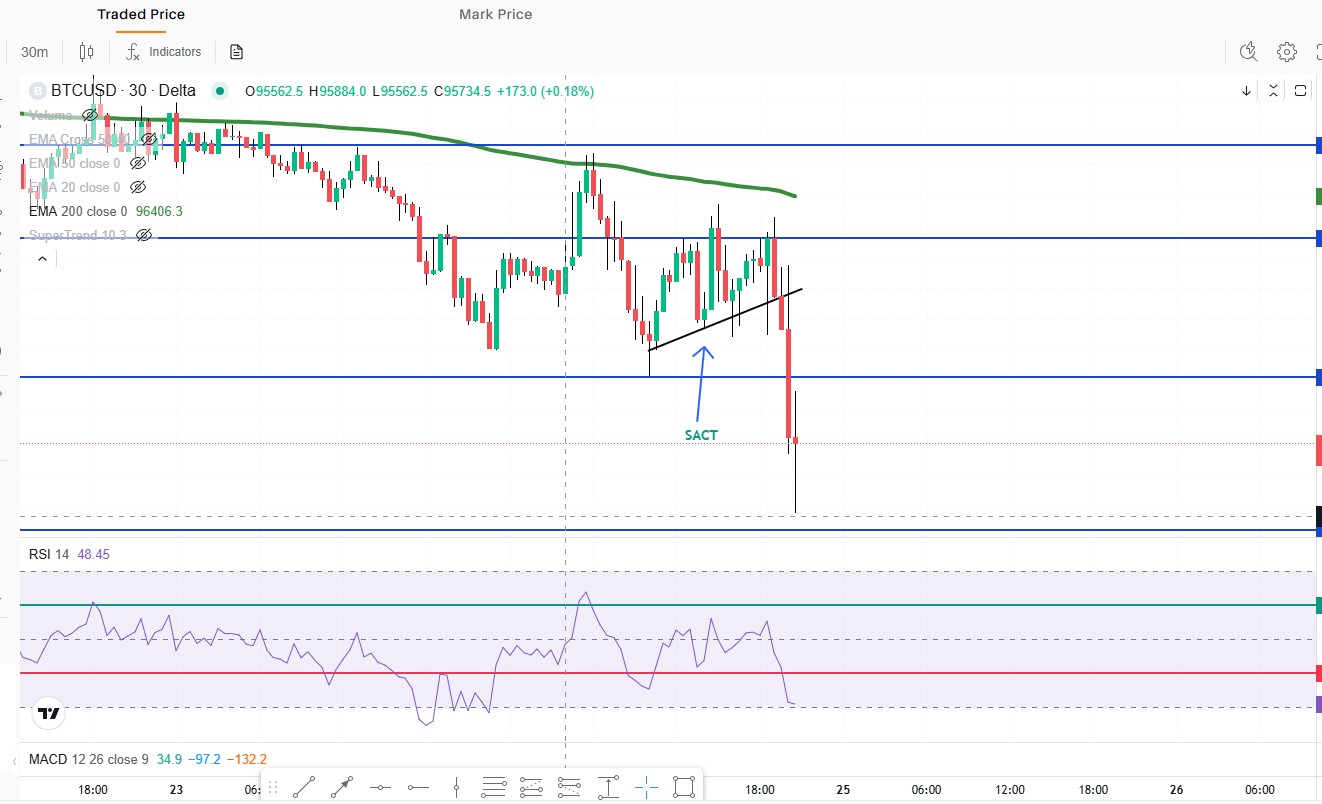
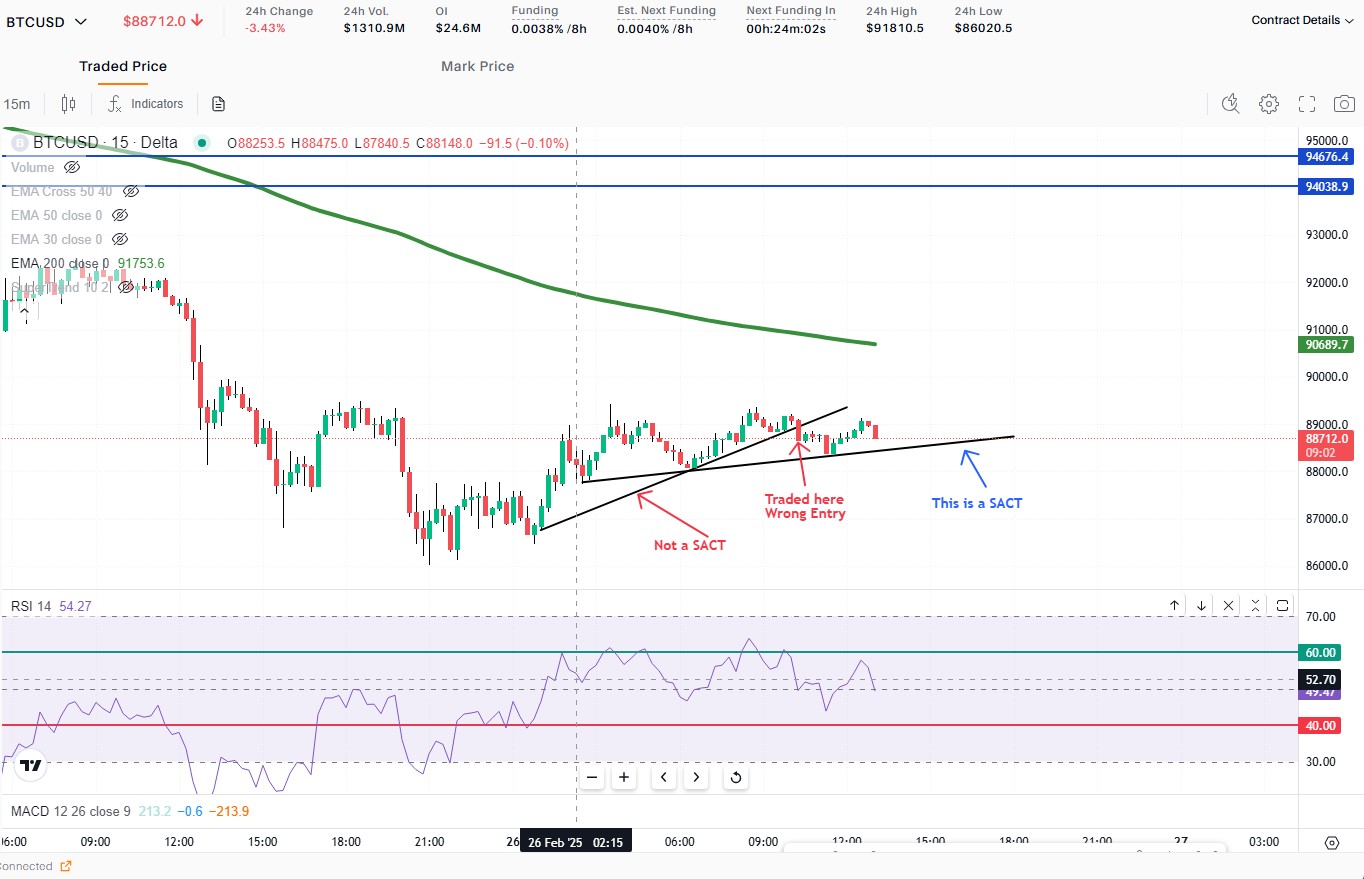
WRONG TRADE_1: PATTERN BREAK (not a SACT)
- Draw a Trendline in PT
- Prices should be below EMA 200
- Look for SACT first then BACT
- Pattern is formed near trendline
- Make sure to do Noise Handling
- In CT
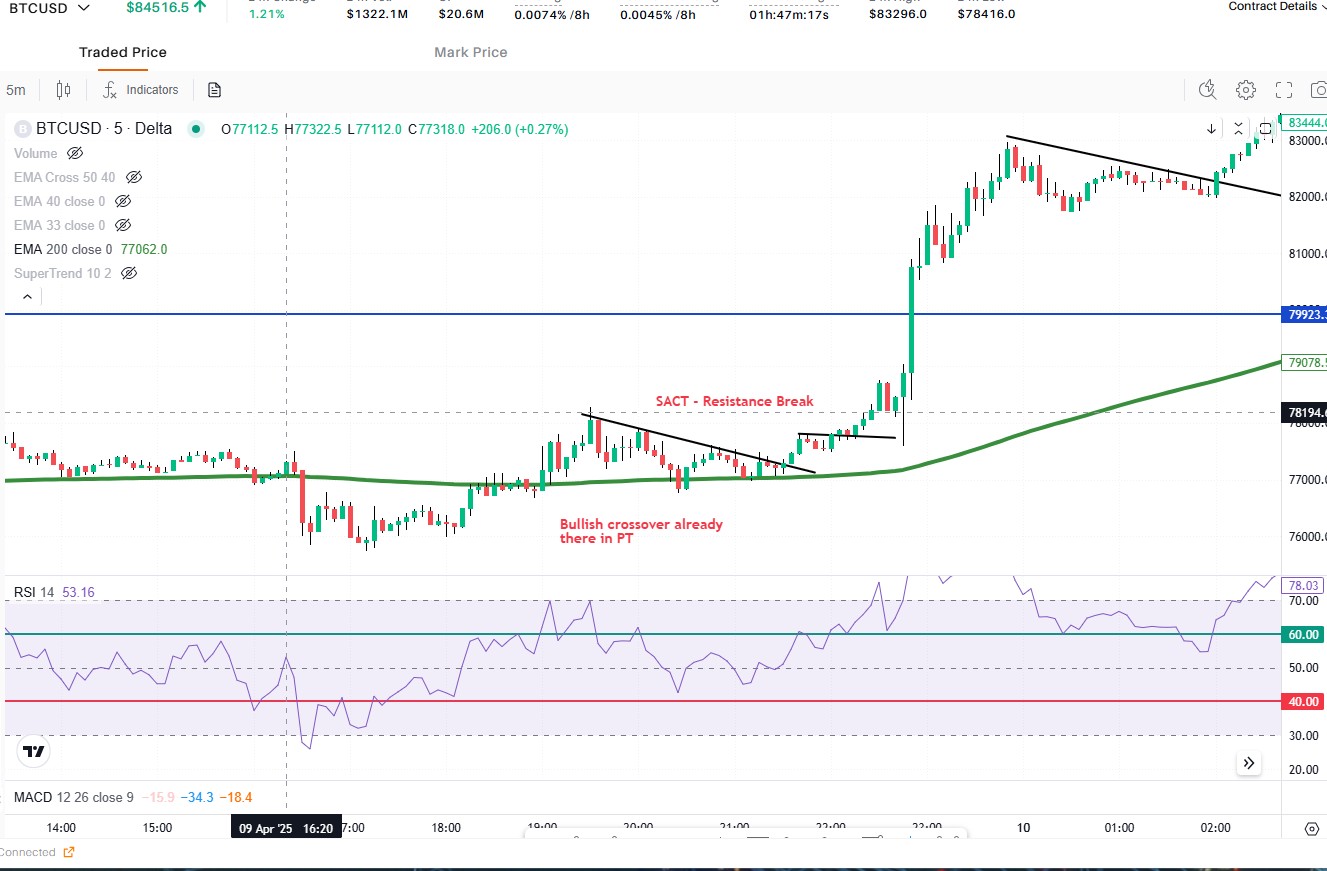
Scenario 3: PATTERN BREAK UPTREND - No Resistance Break required
- Price in PT should be above EMA 200
- In CT Price should be above and not touching EMA 200
- Draw a Counter Trendline
- RSI should be above 40 when break happens
- PT - MACD should have made bullish crossover
- Entry in Break
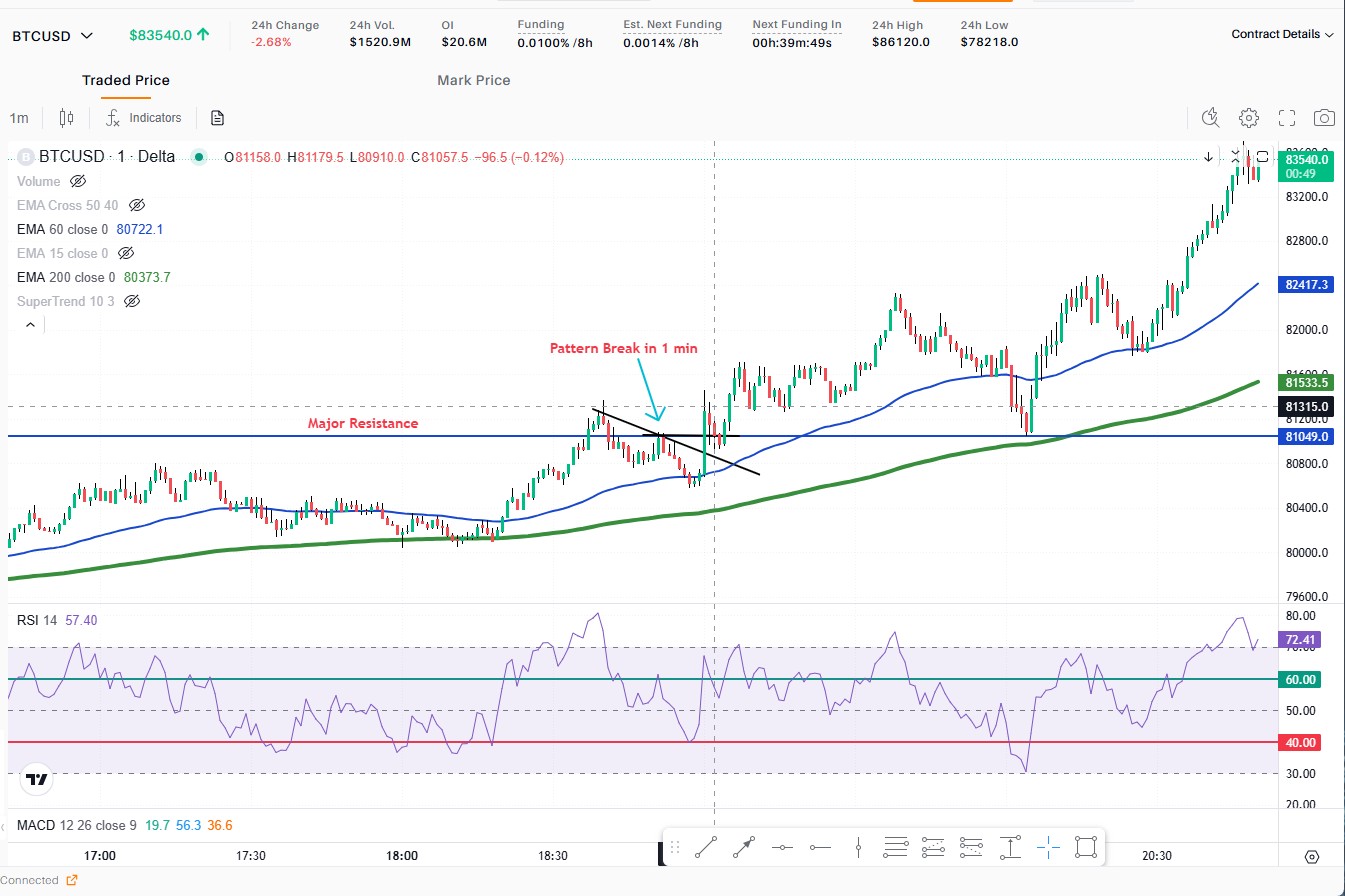

Scenario 3: PATTERN BREAK UPTREND - Resistance Break required
- Price in PT should be above EMA 200
- In CT Price should be above and can be touching EMA 200
- Draw a Counter Trendline
- PT - MACD should have made bullish crossover
- Entry in Break