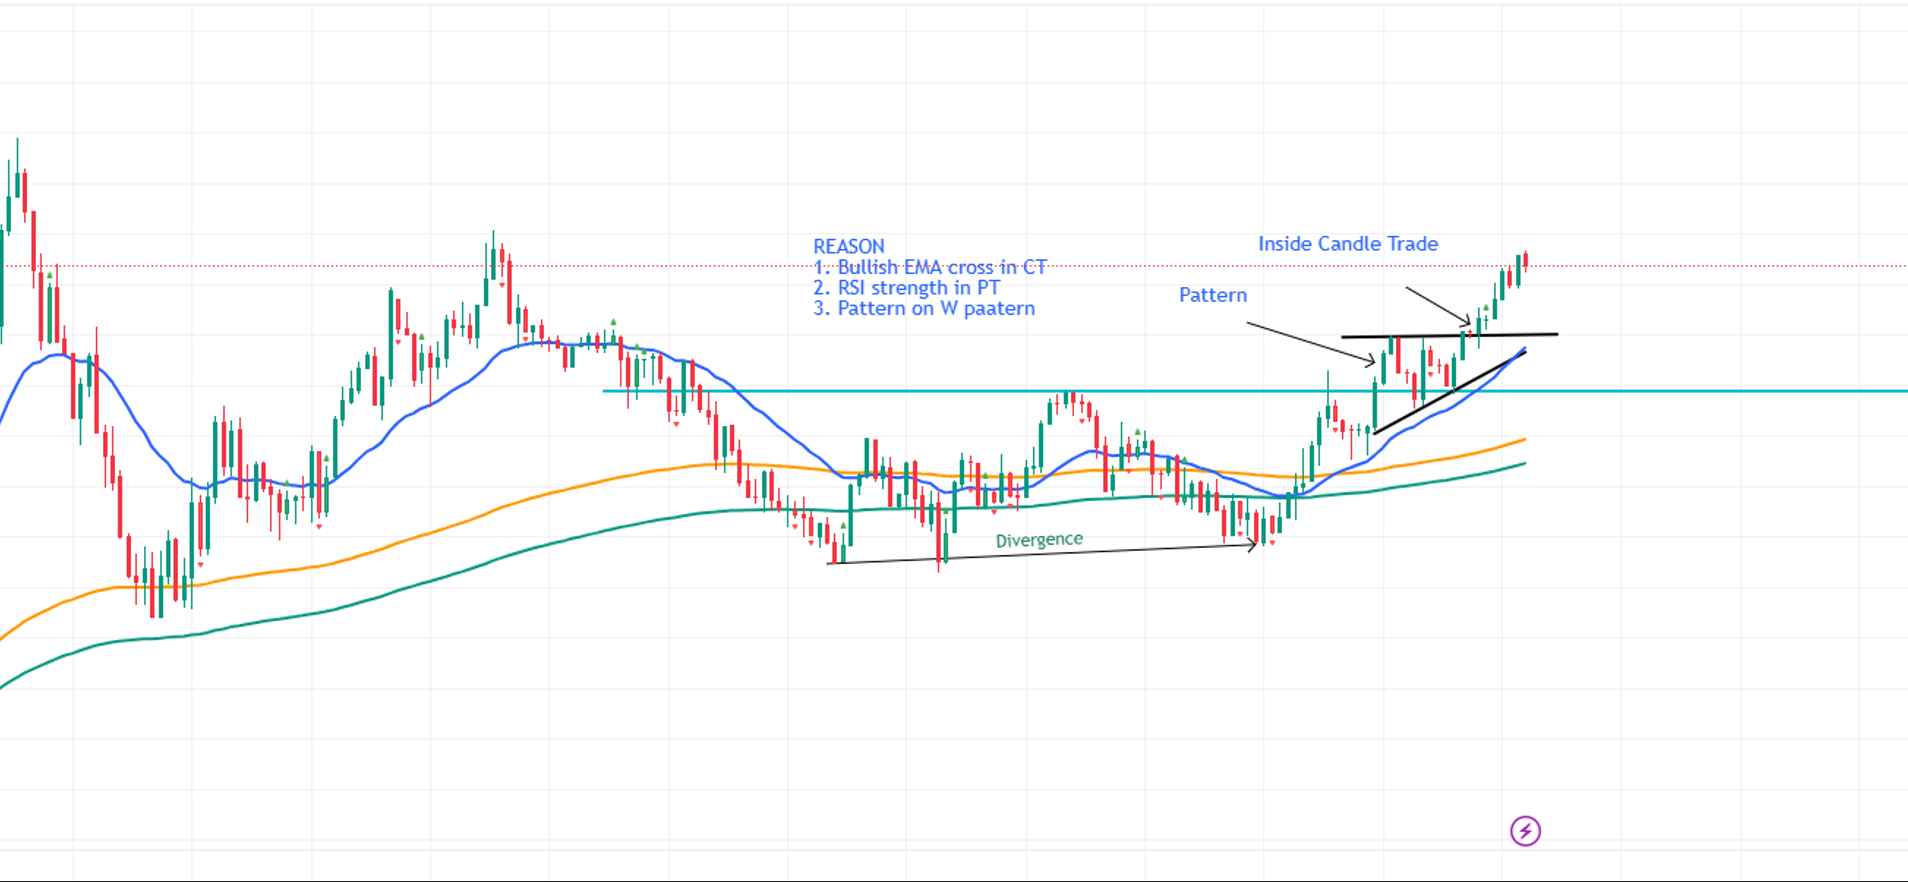
W Pattern
Higher Timeframe (PT)
- Prices should be above 200 EMA
- RSI exibhits strength
Entry Timeframe (CT)
- Bullish EMA cross of 150/200
- Price should touch the support twice
- Price should break above EMA 50
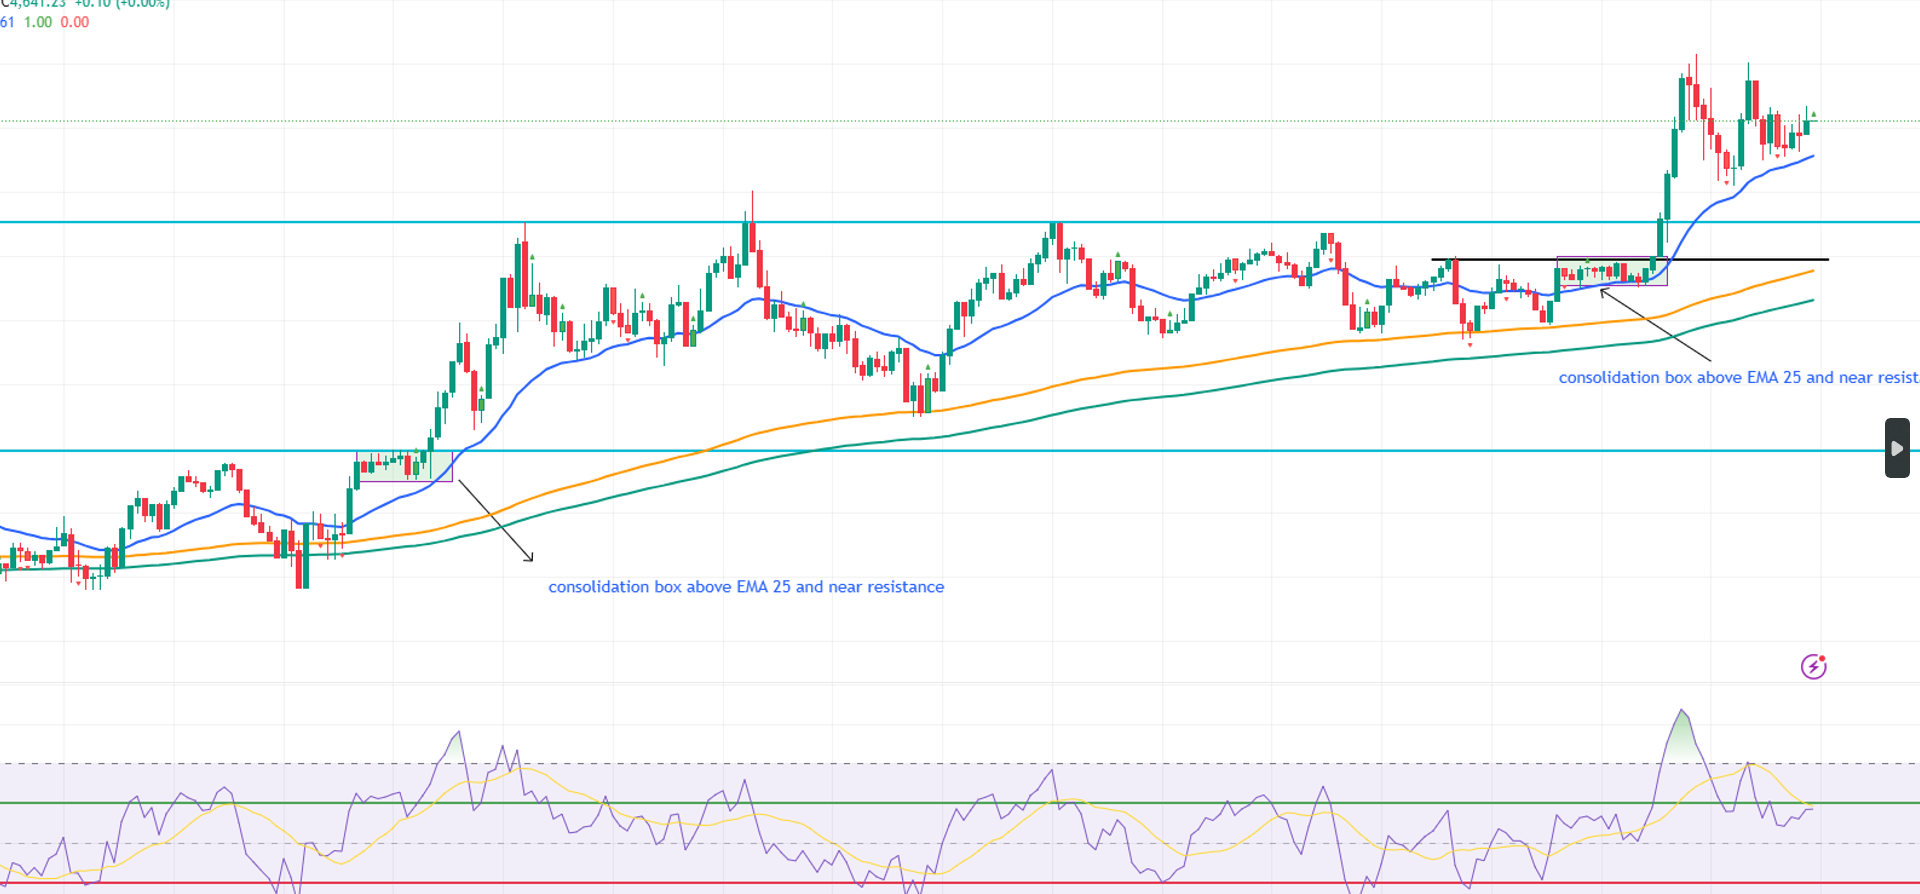
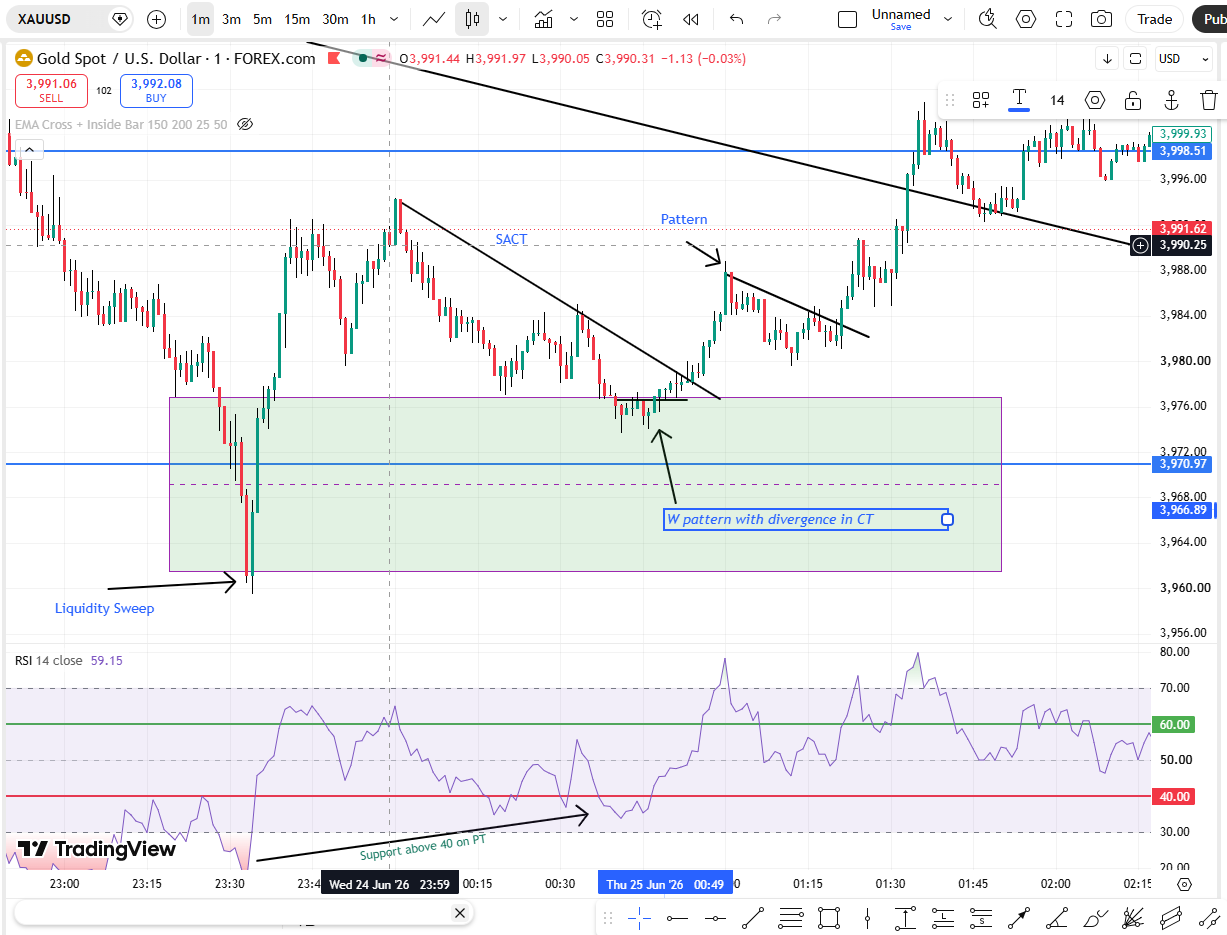
W Pattern
Higher Timeframe (PT)
- Prices should be above 200 EMA
- RSI exibhits strength
Entry Timeframe (CT)
- Bullish EMA cross of 150/200
- Price tight consolidation box
- Pattern formed should be above EMA 25
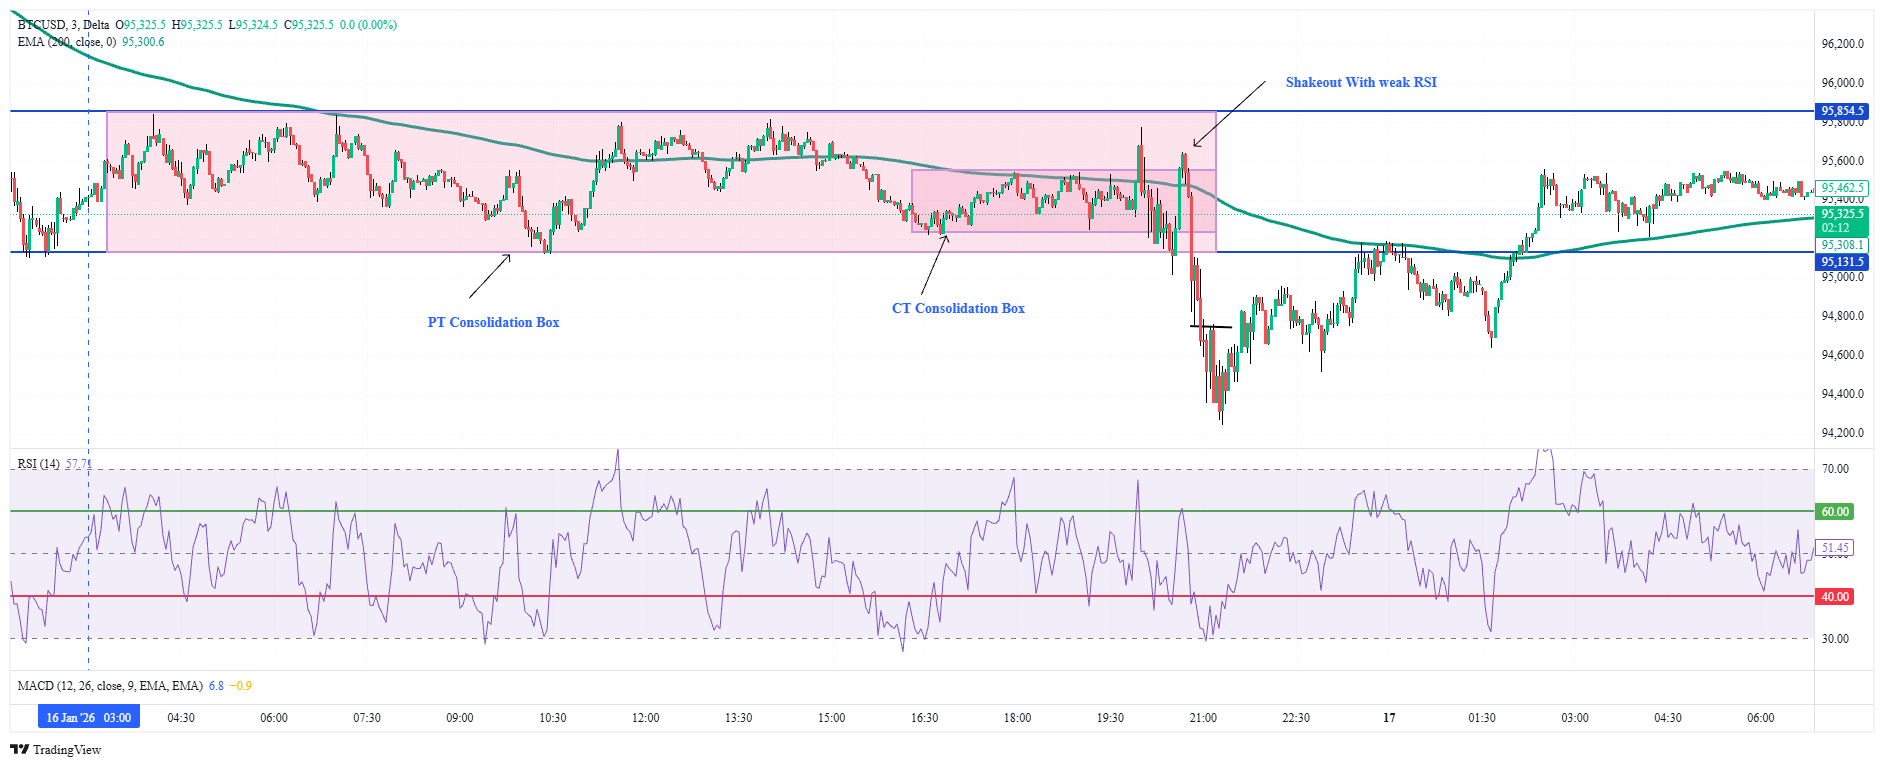
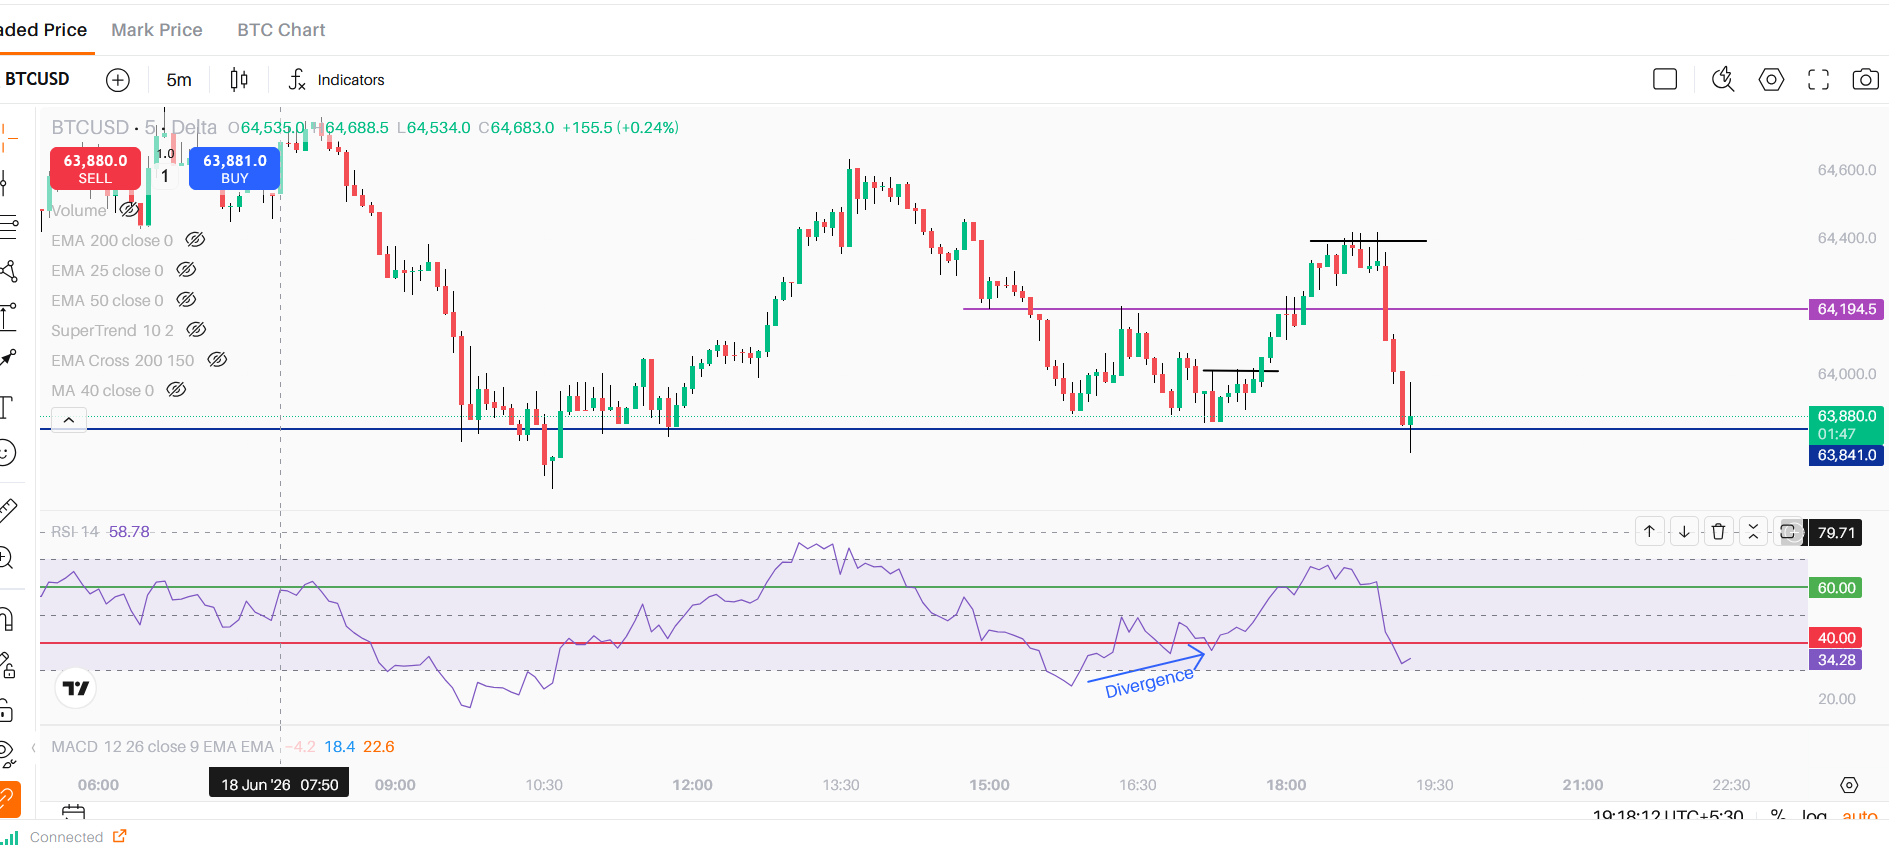
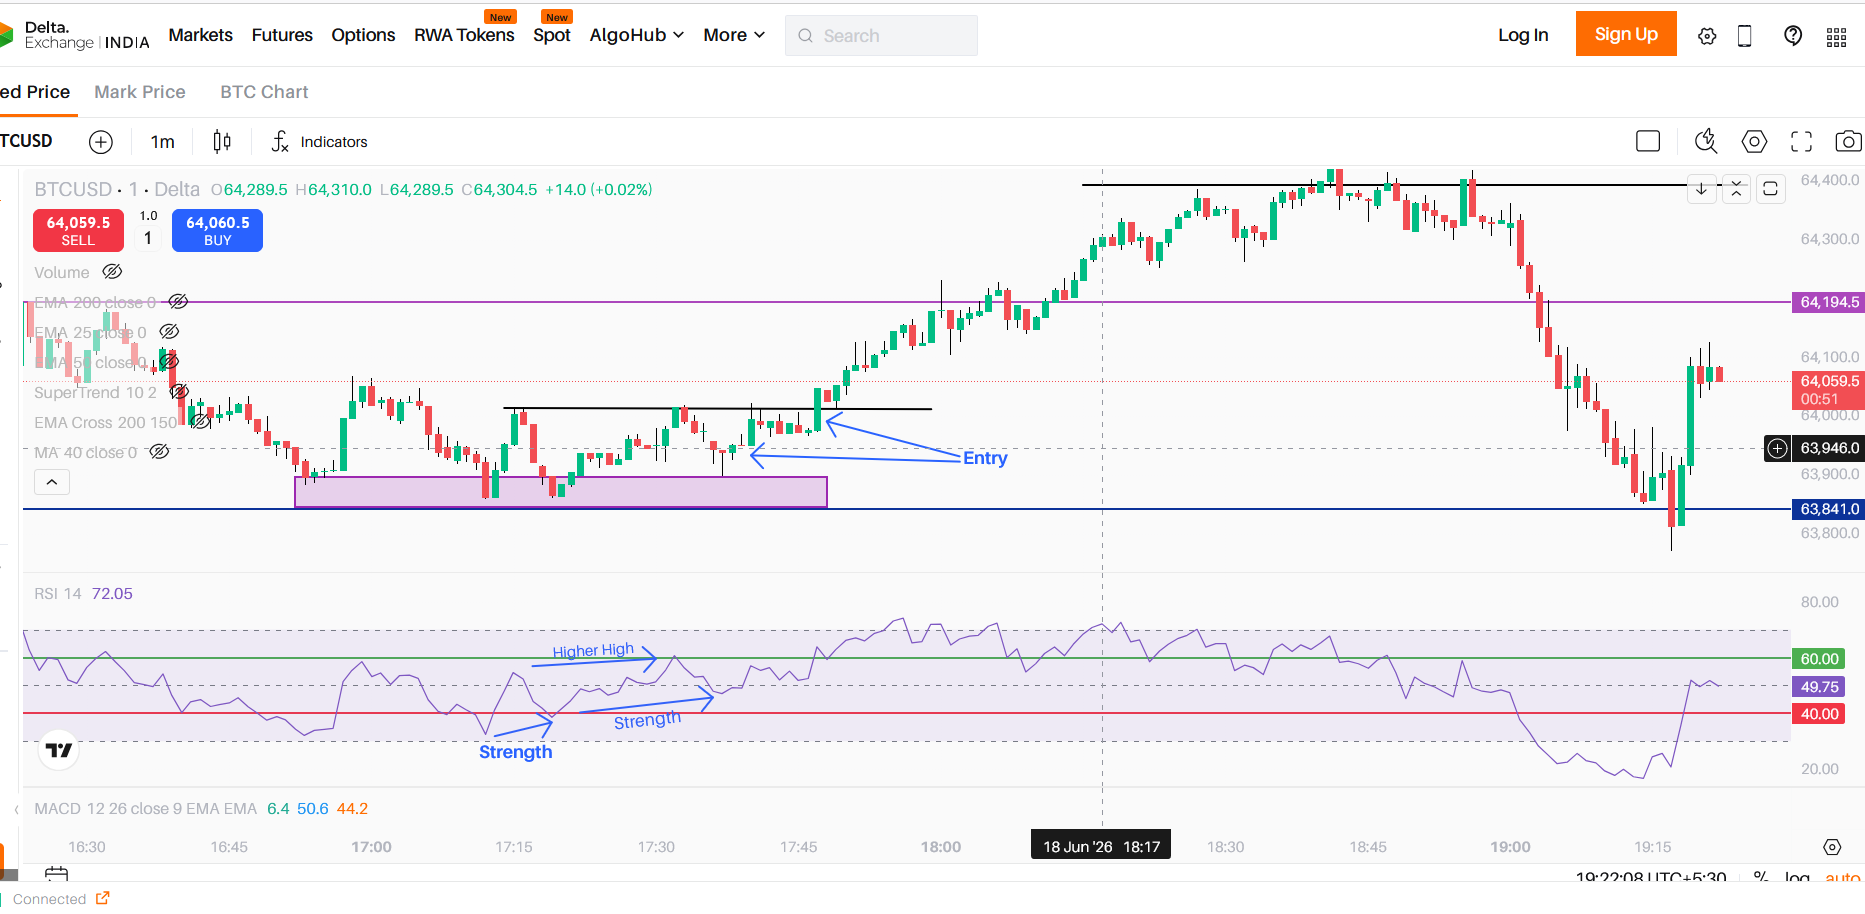
Shakeouts
Higher Timeframe (PT)
- Prices should be above 200 EMA
Entry Timeframe (CT)
- Prices should be in a range
- Draw Support/Resistance
- Wait for price to breach Support Resistance
- RSI strength/weakness
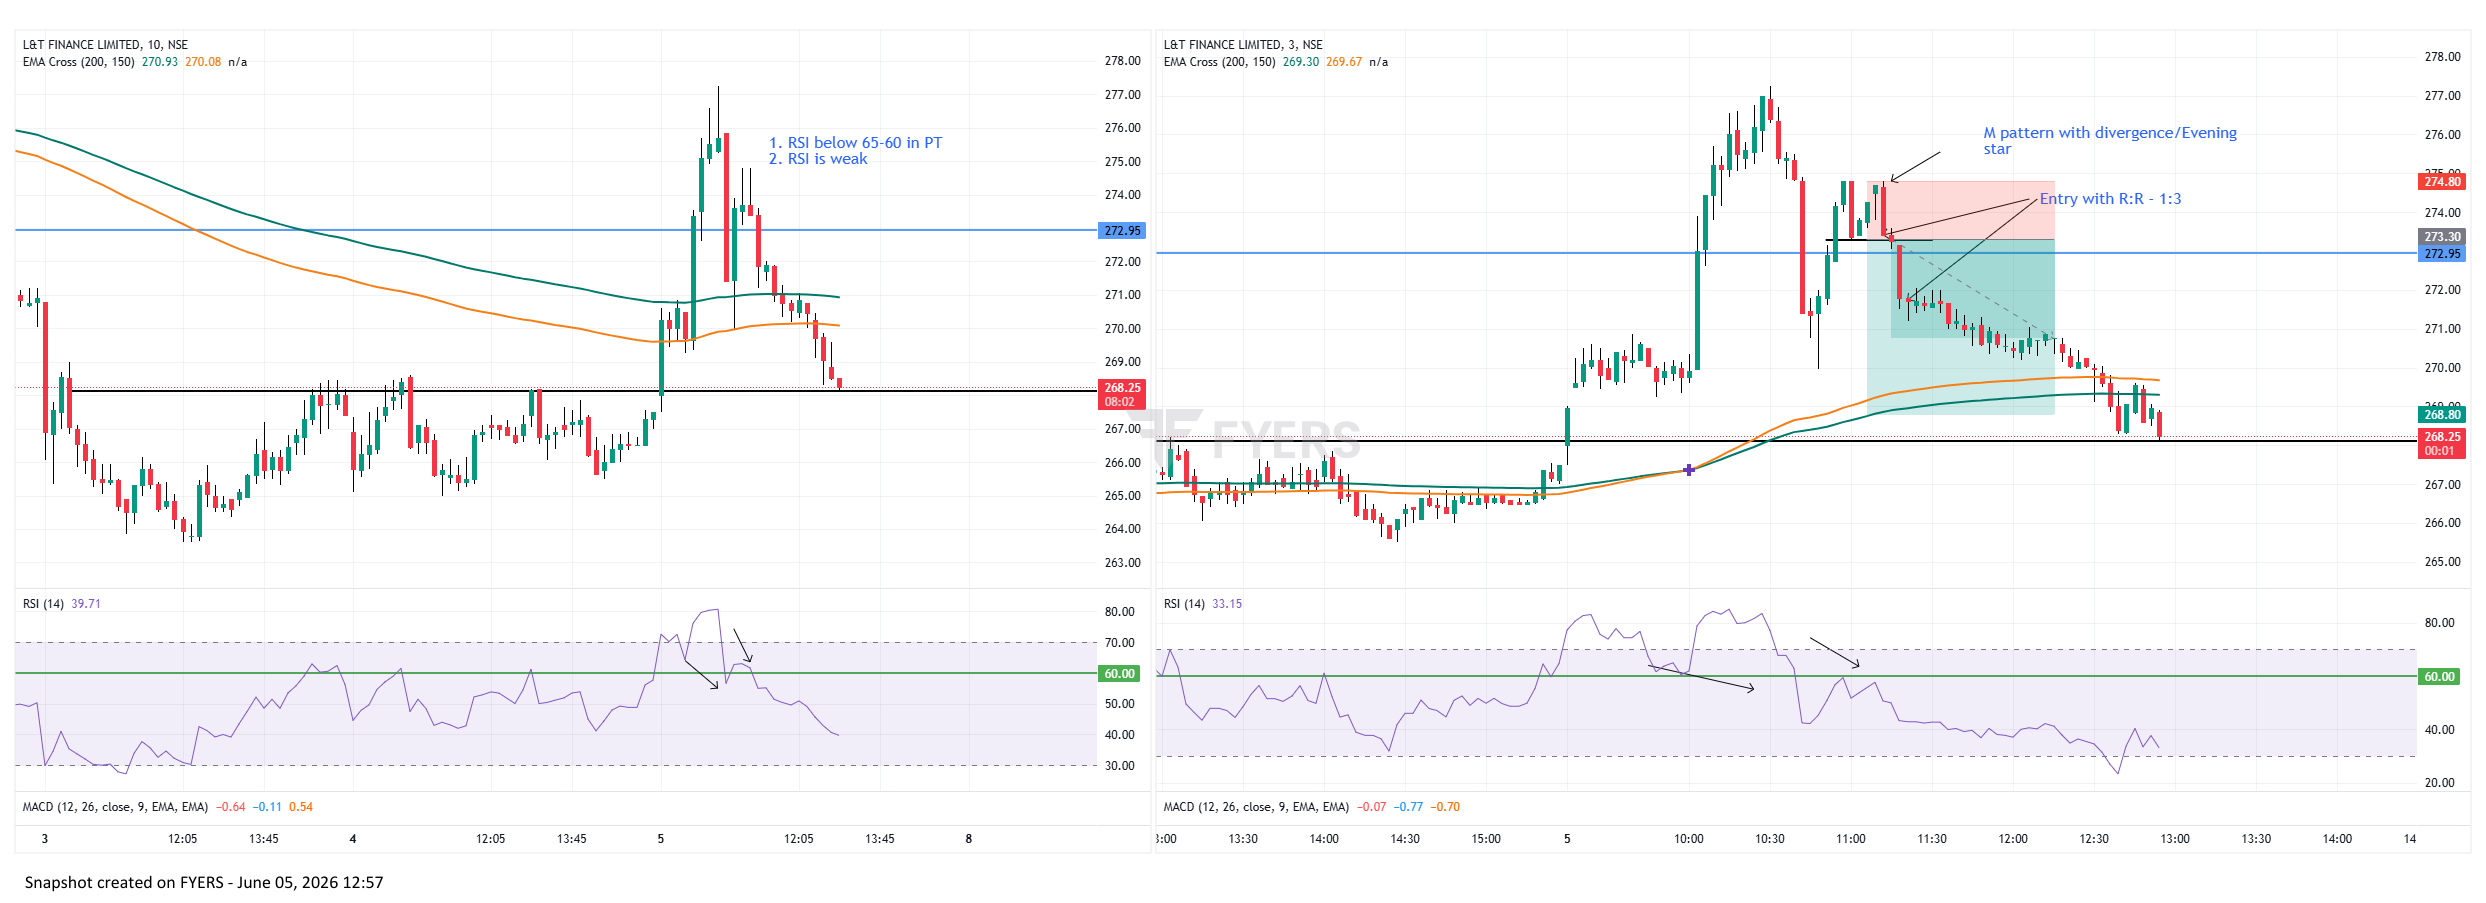
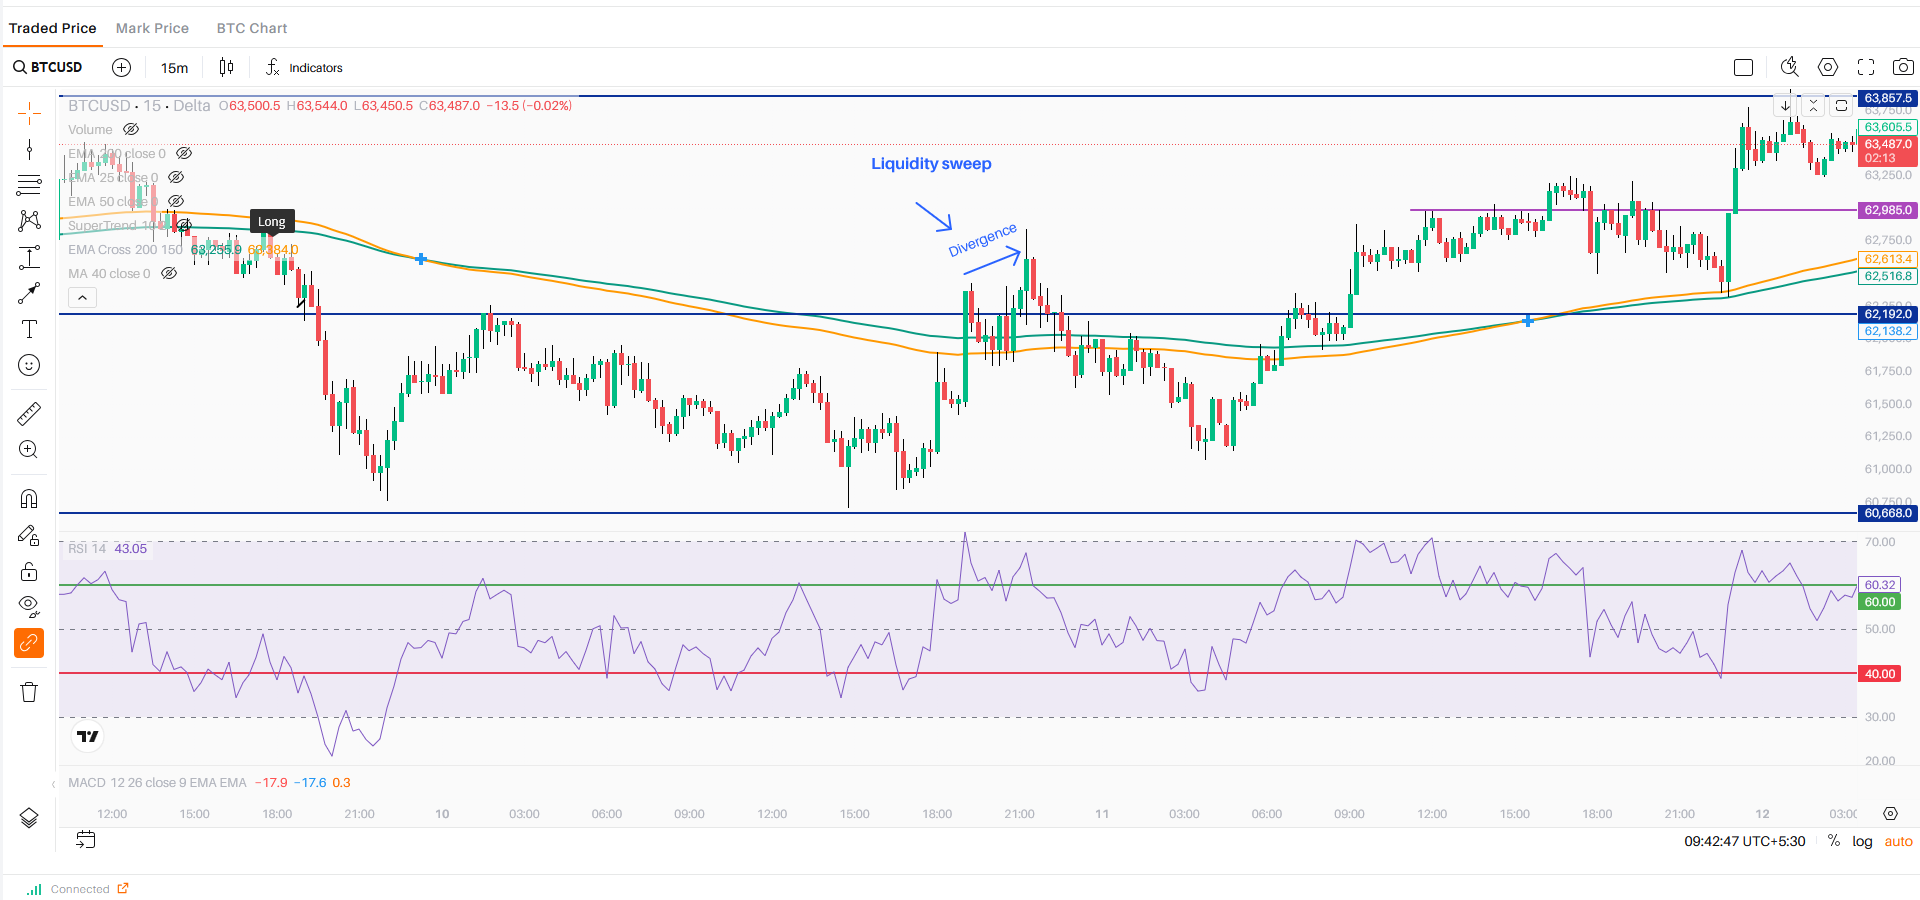
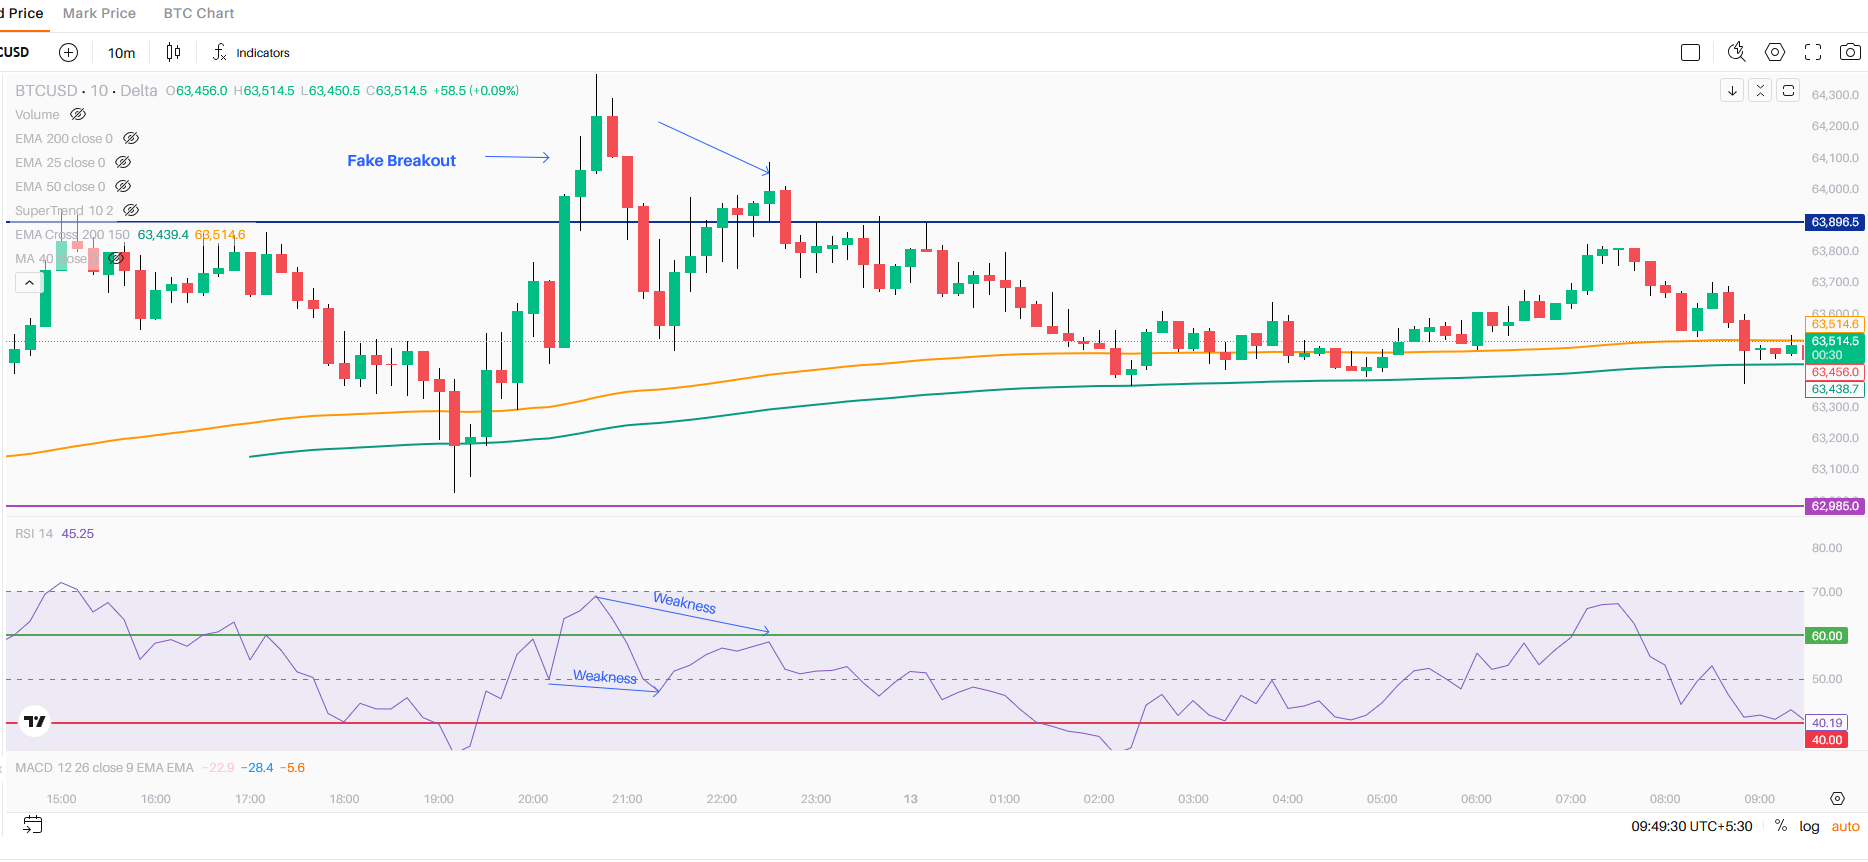
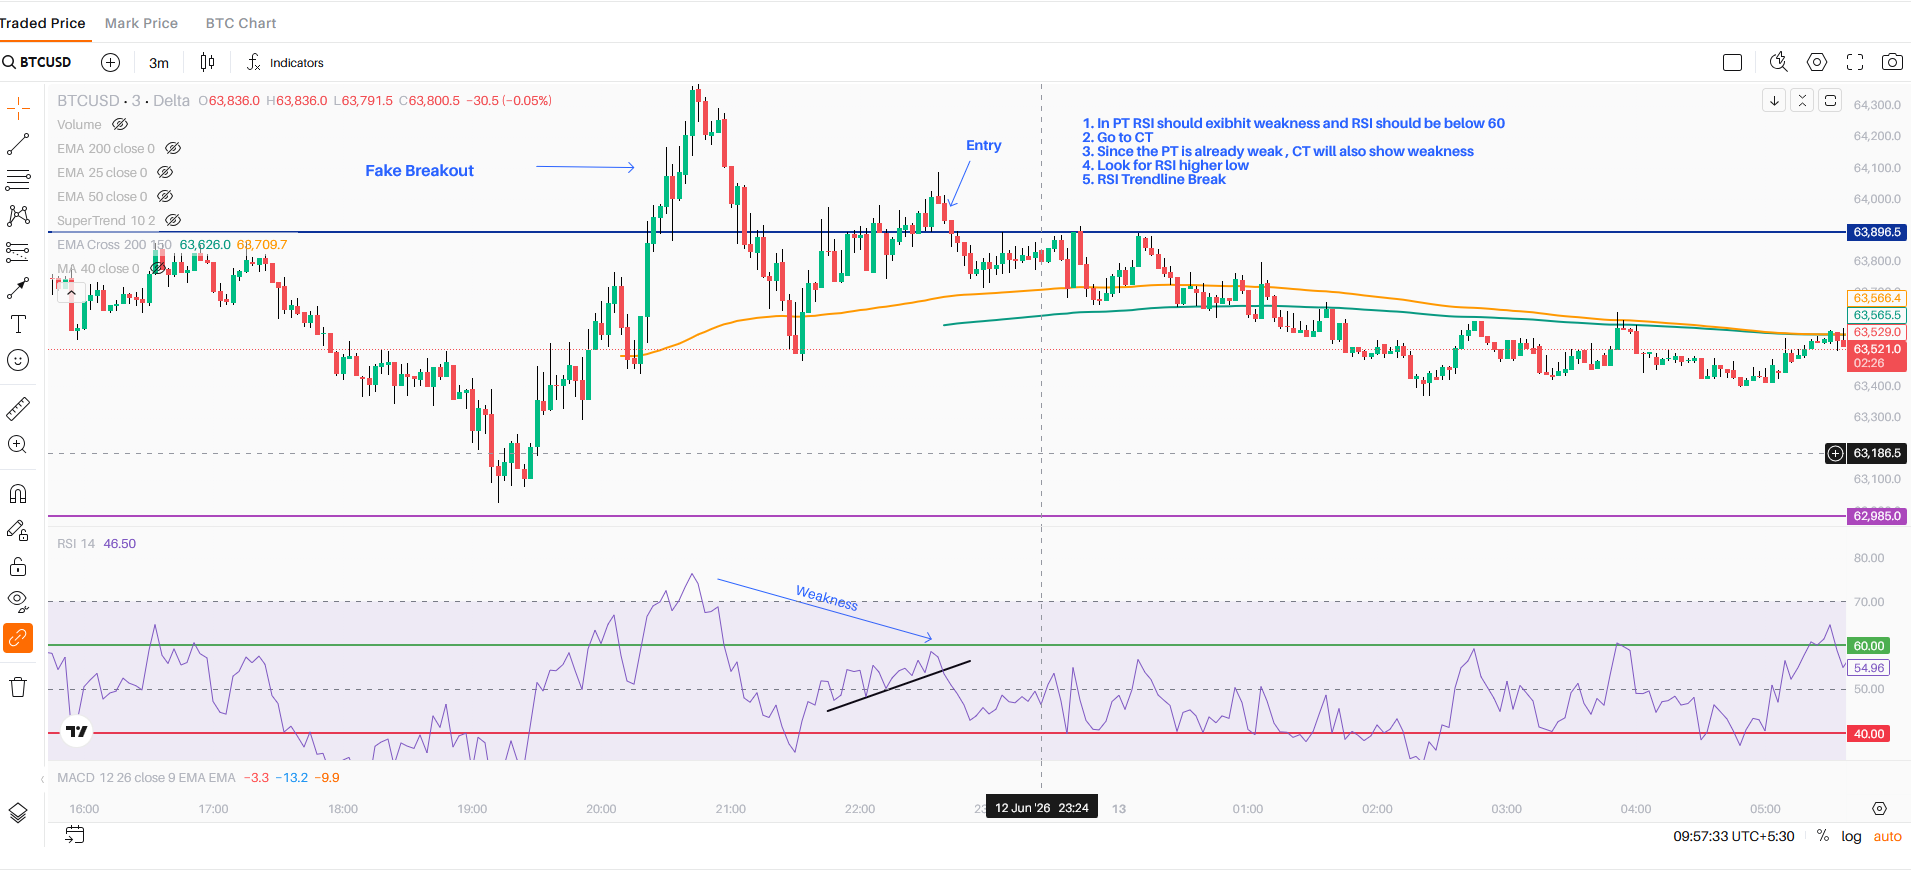
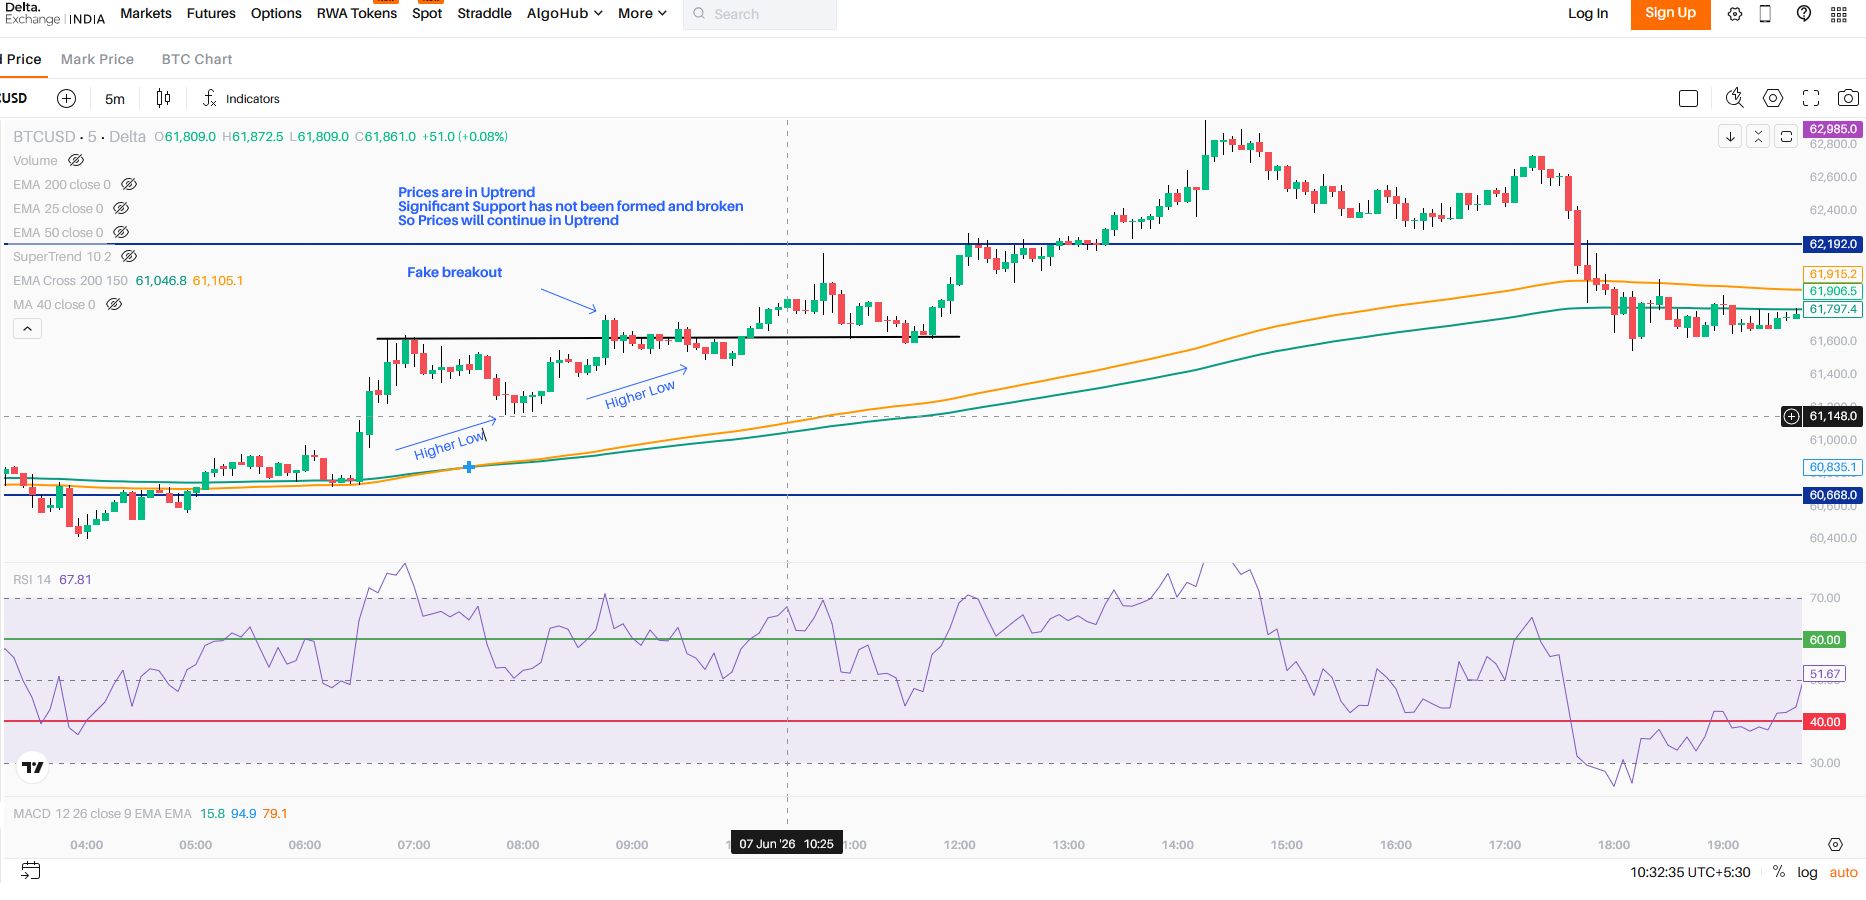
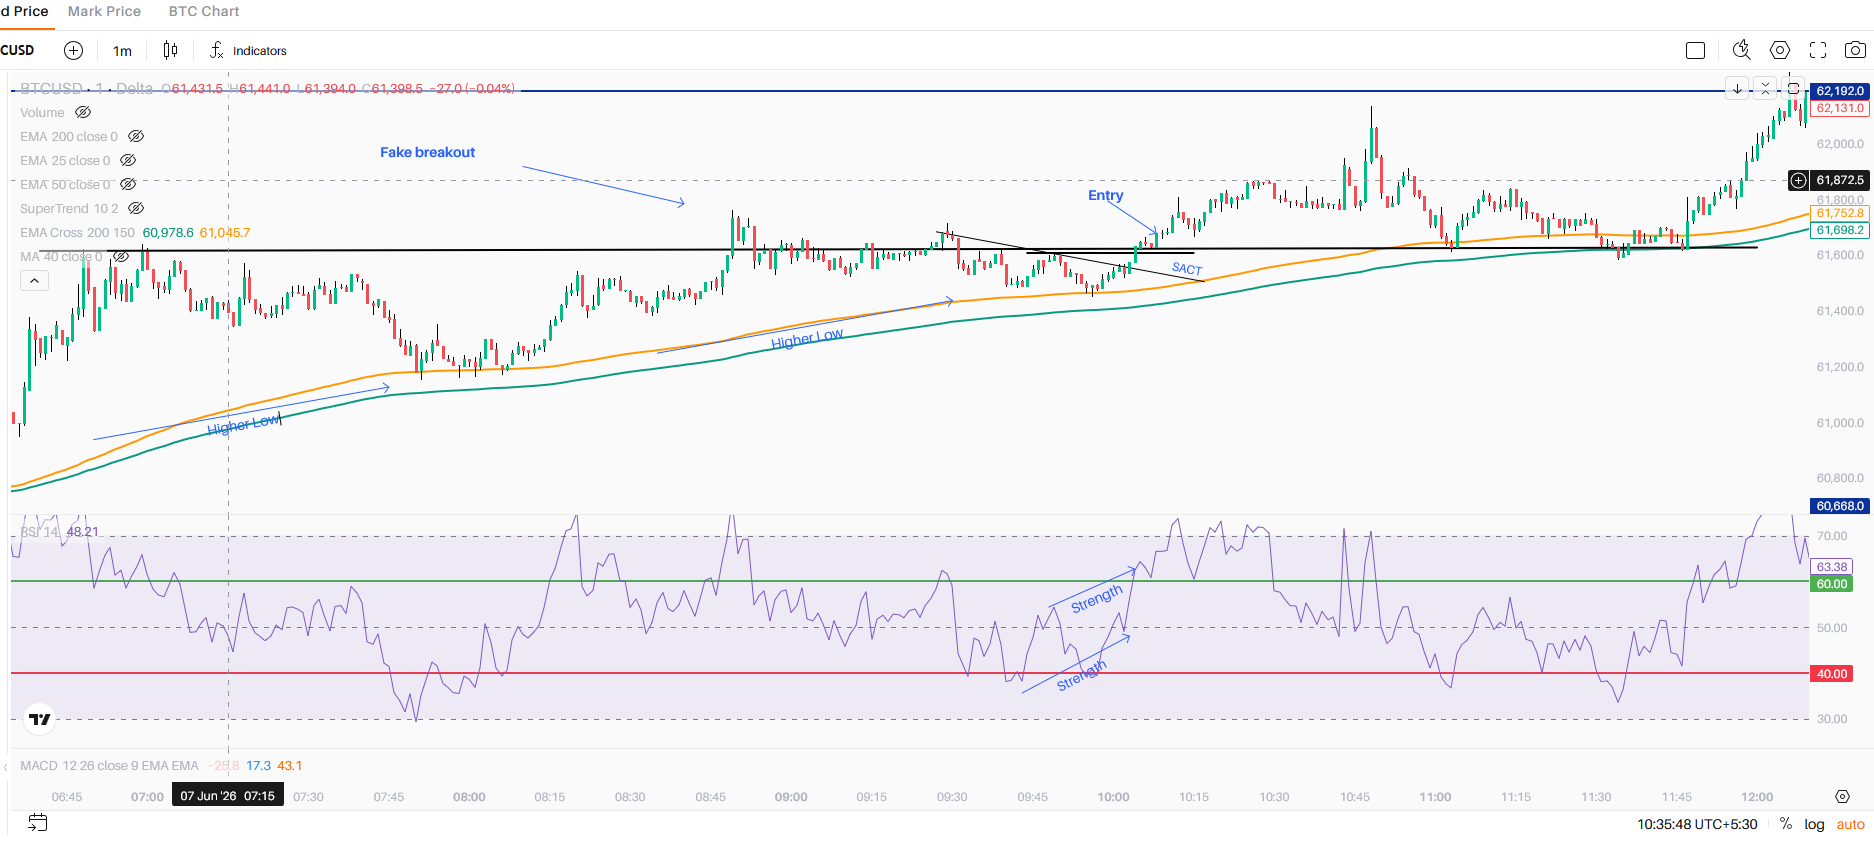
Fake Breakouts
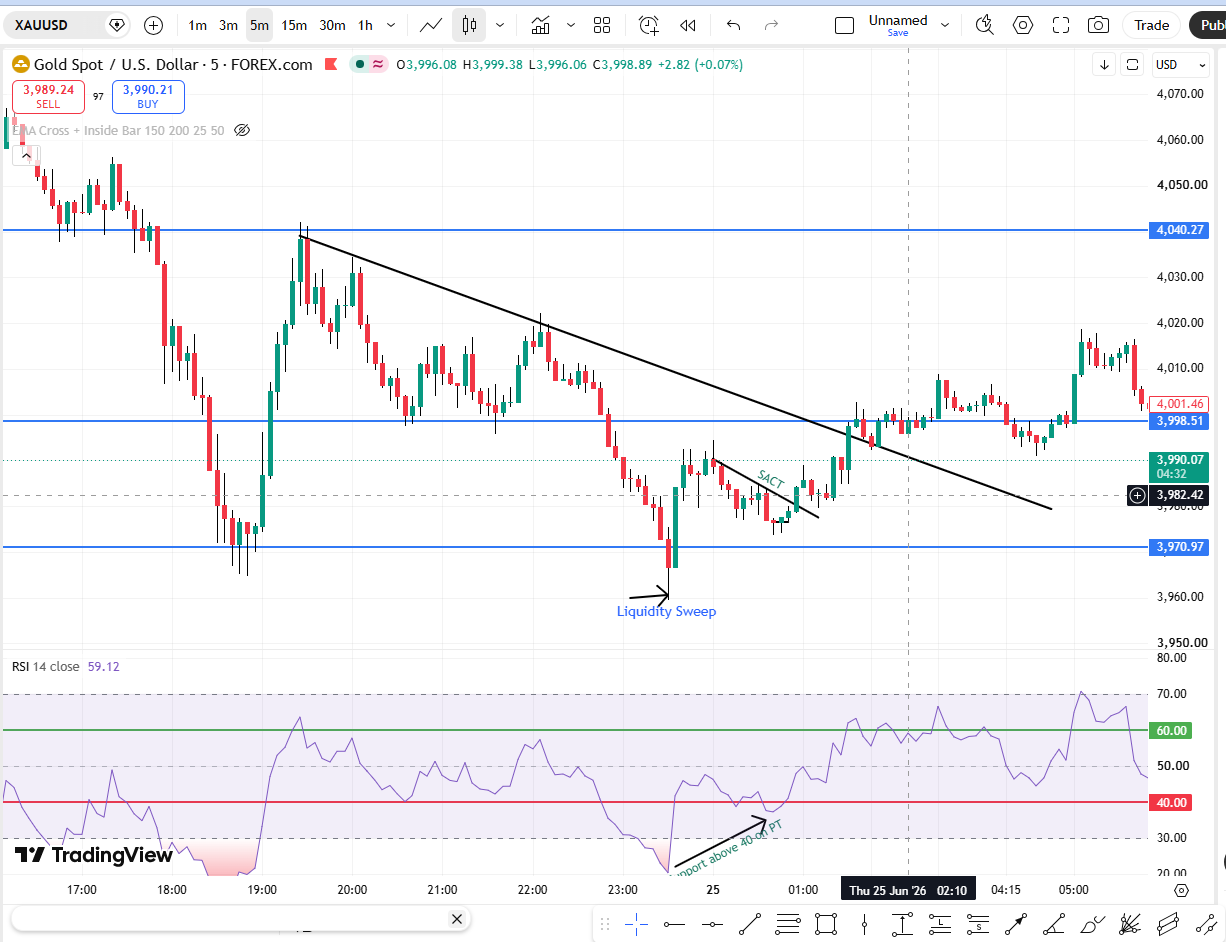
Rules For Liquidity Sweep
- Prices are in Uptrend - Always look for Long trades
- Short Trades In Bullish Market is applicable only when there has been a break of Significant Support
- RSI should be below 60
- Draw Resistance on Parent Time
- Prices are in Downtrend - Always look for Long trades
- Long Trades In Bullish Market is applicable only when there has been a break of Significant Resistance
- RSI should be above 40
- Draw Support on Parent Time
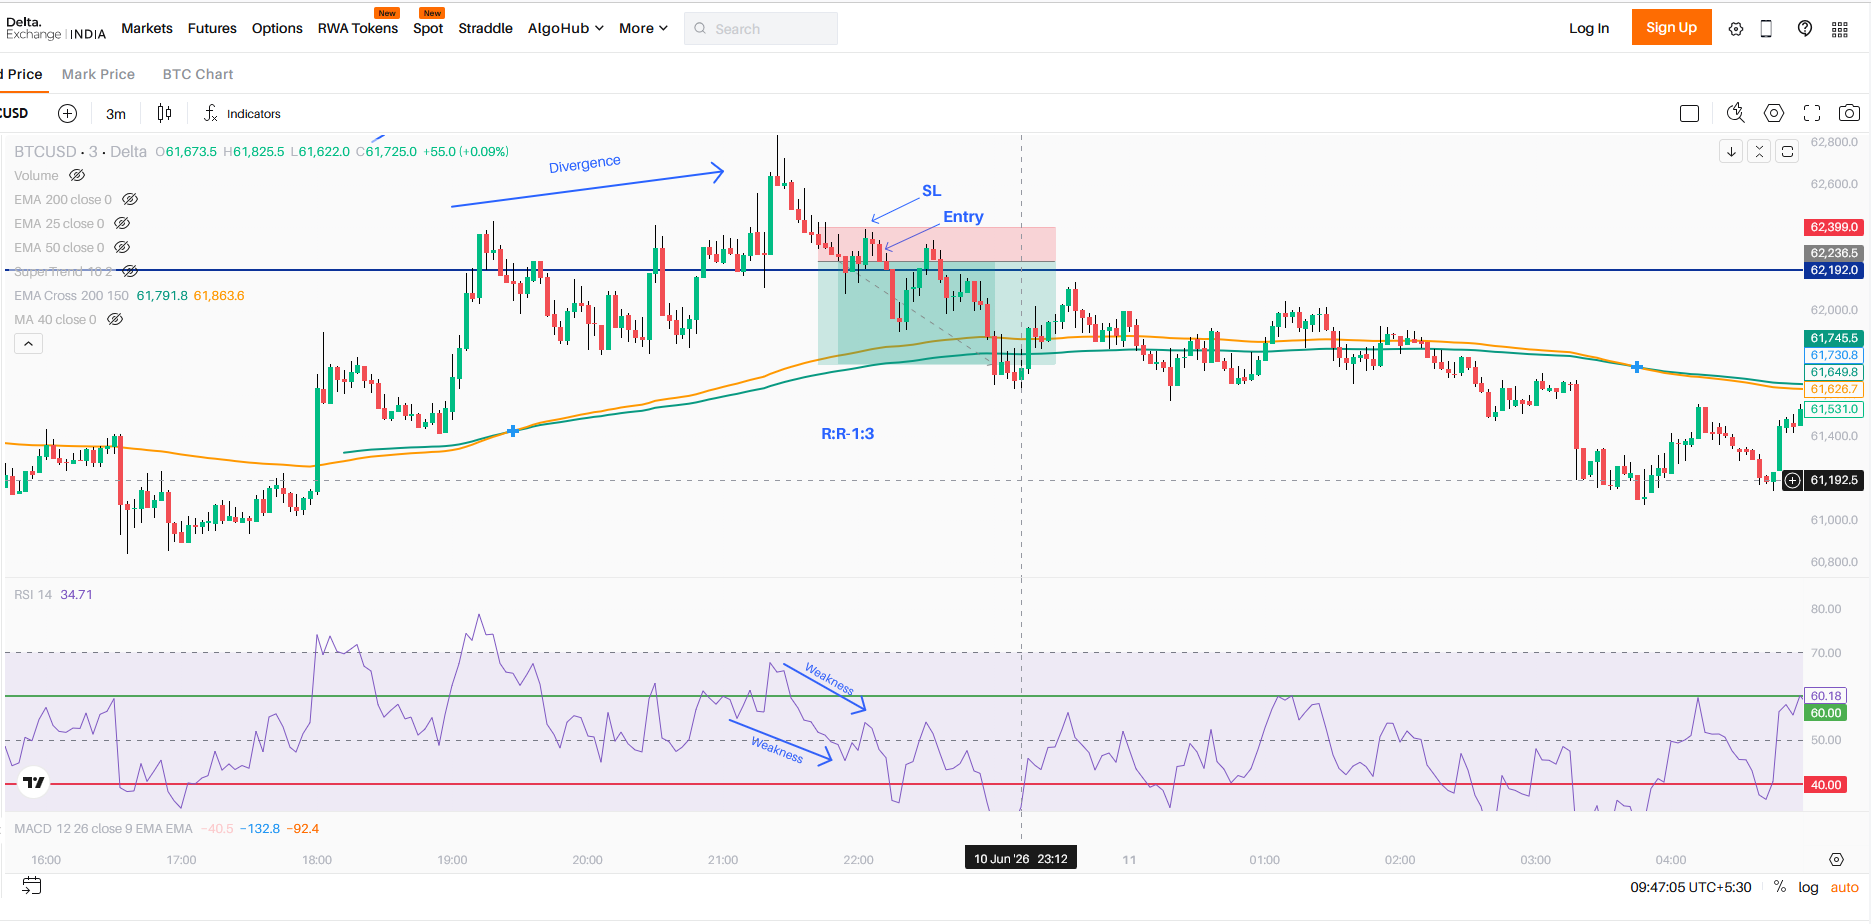
Higher Timeframe (PT)
- RSI below 60 for SELL and RSI above 40 for BUY
- Draw Support/Resistance
- RSI should exhibit strength/weakness
Entry Timeframe (CT)
- Wait for price to breach Support Resistance and retrace back to Support/Resistance
- RSI should exhibit strength/weakness
- R:R - 1:3
Example - 1
Example - 2
Example - 3
Example - 4
Example - 5