EMA
EMA Bounce Rules
- Prices should be above EMA 200 and above EMA 25 in PT
- The price should Have broken significant Support or Resistance
- In uptrend it should make resitance and in downntrend it should create support
- Check the retracement in PT
- Prices should always be above EMA in PT in Uptrend and below in Downtrend
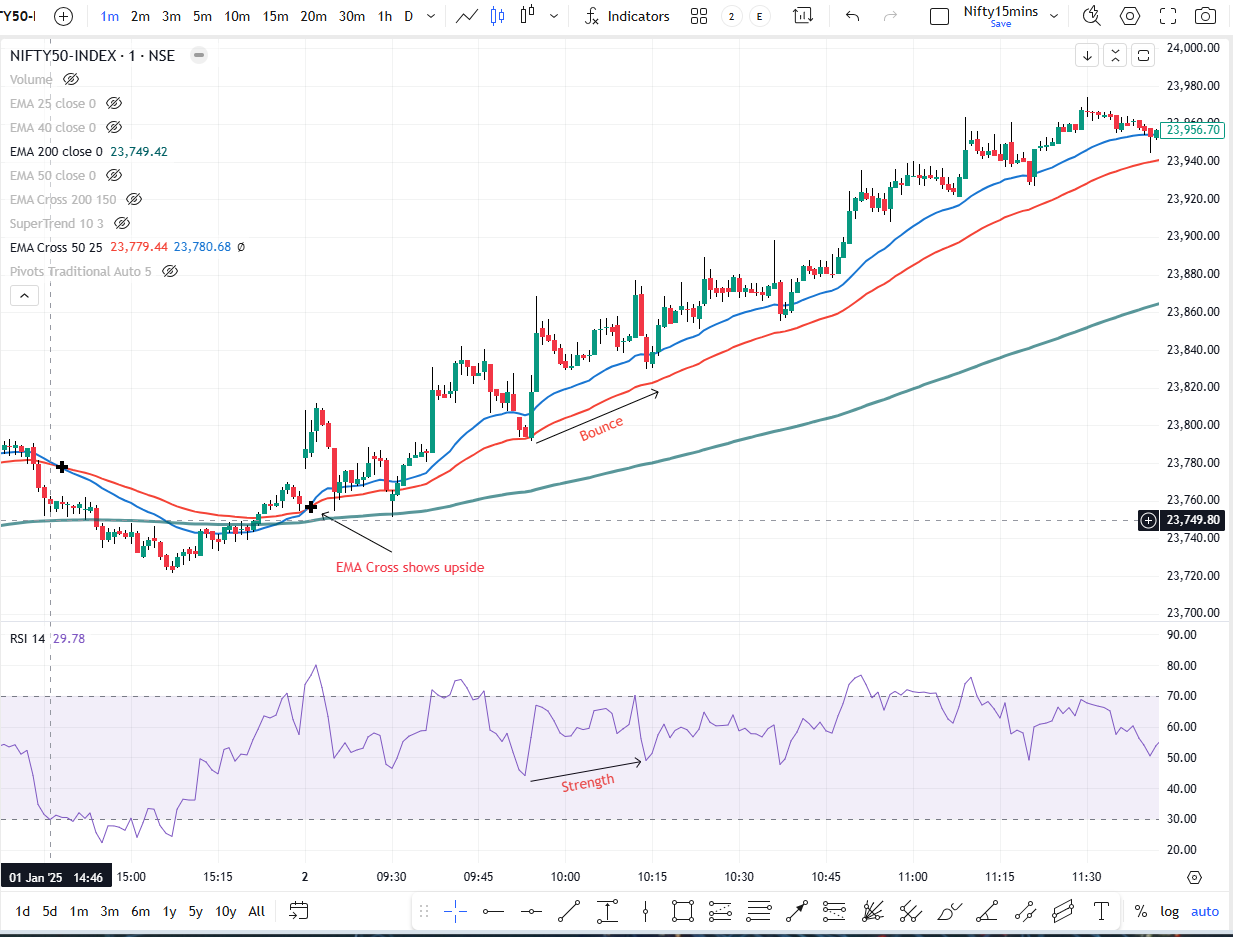
- Draw a trendline and map EMA or use EMA cross 25 and 50 (as it shows momentum)
- Then look for price crossing EMA
- RSI Should exhibit strength or weakness
Scenario 1: EMA Bounce or Divergence in CT
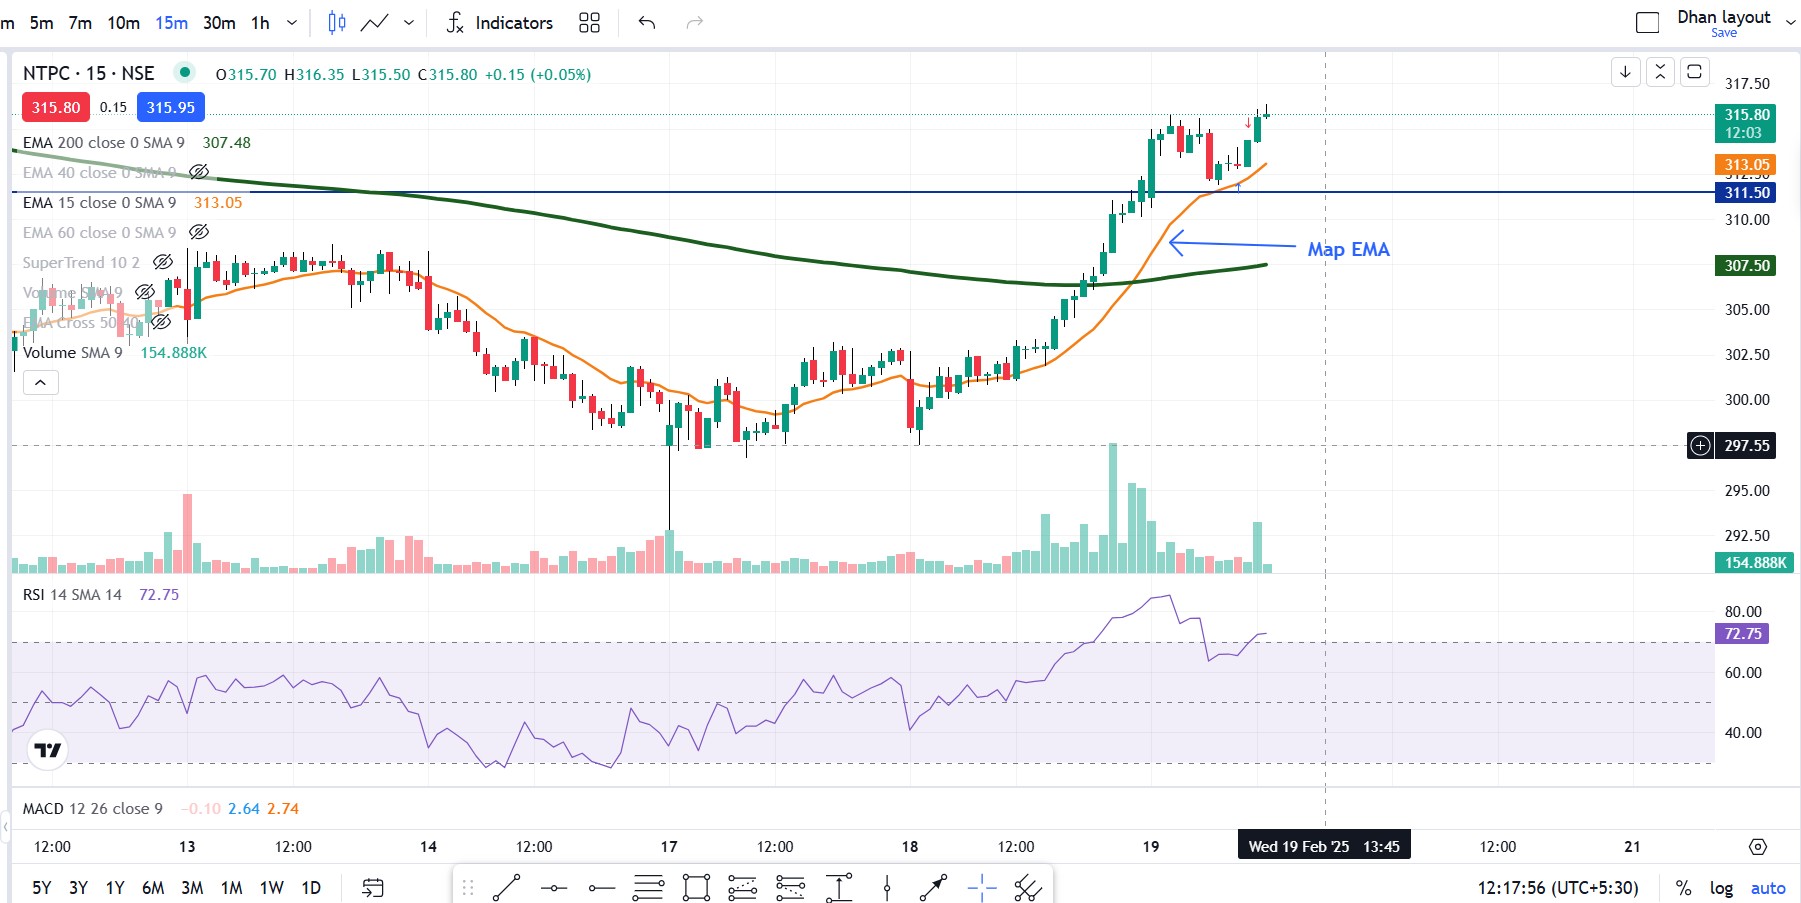
Higher Timeframe (PT)
- Prices are above EMA 200
- Map prices with EMA in PT
- As long as prices stay above EMA in PT, the stock is trending up
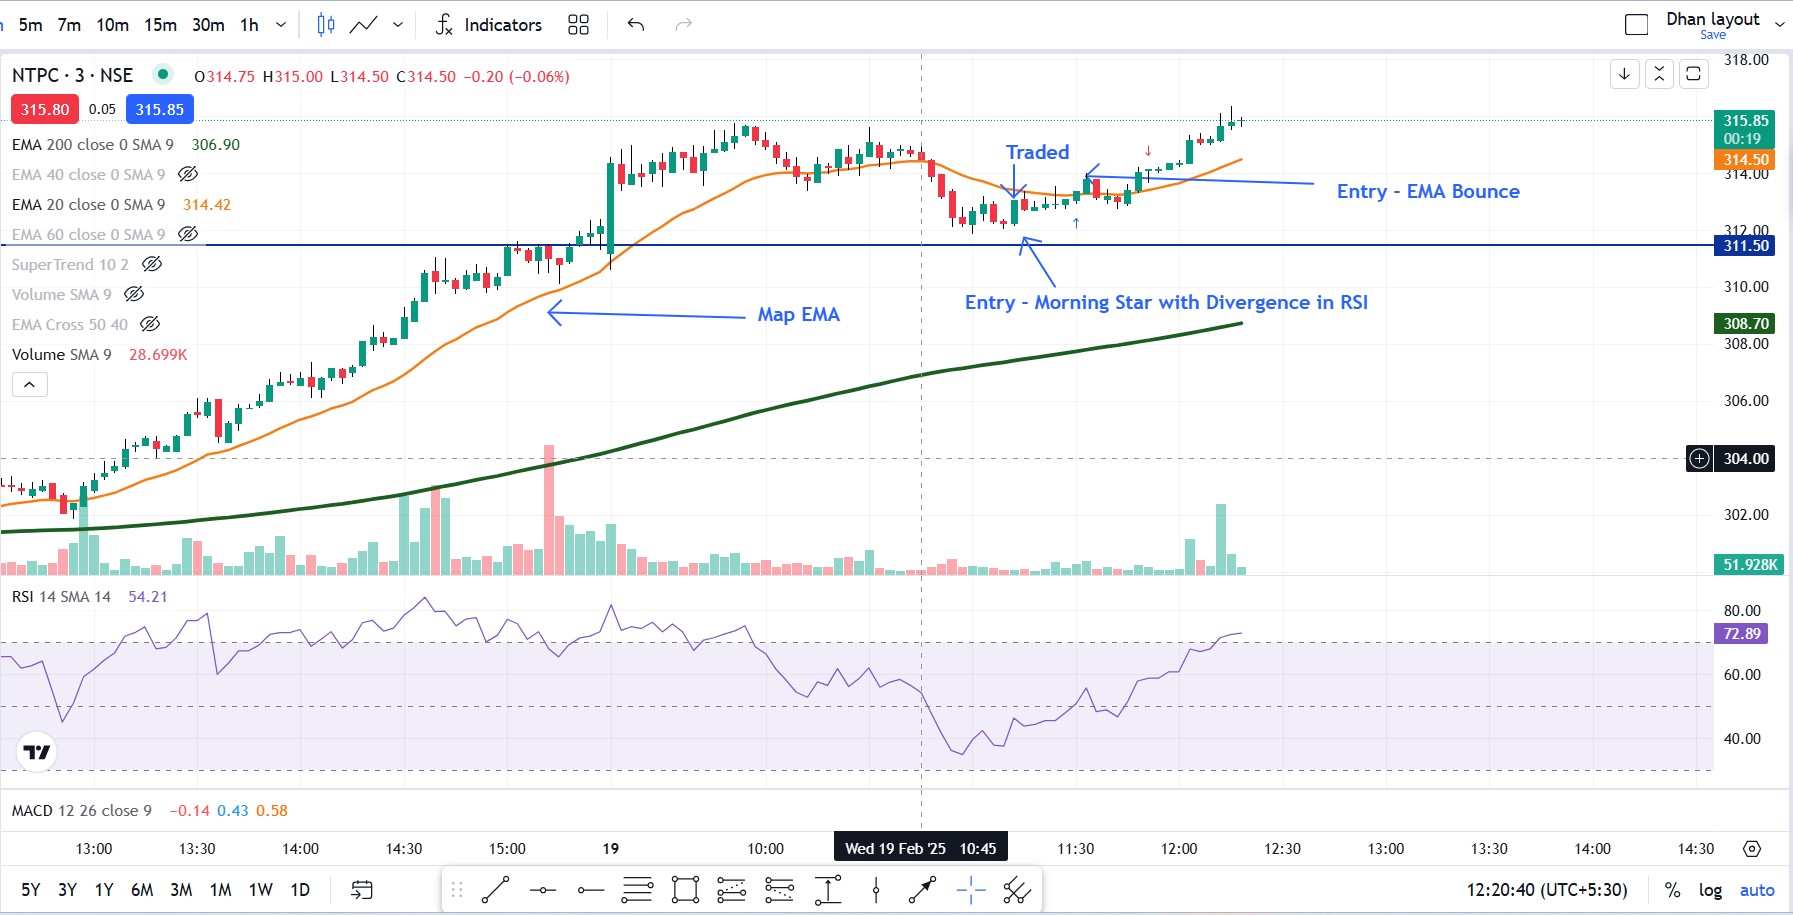
Entry Timeframe (CT)
- Map EMA on price in CT
- Wait for prices to go below EMA
- Do not trade if there is a regular bearish divergence
- Look for divergence on or above RSI 40
- Look for small boxes or consolidation
- Watch for candlestick patterns and EMA bounce
Scenario 2: Breakout
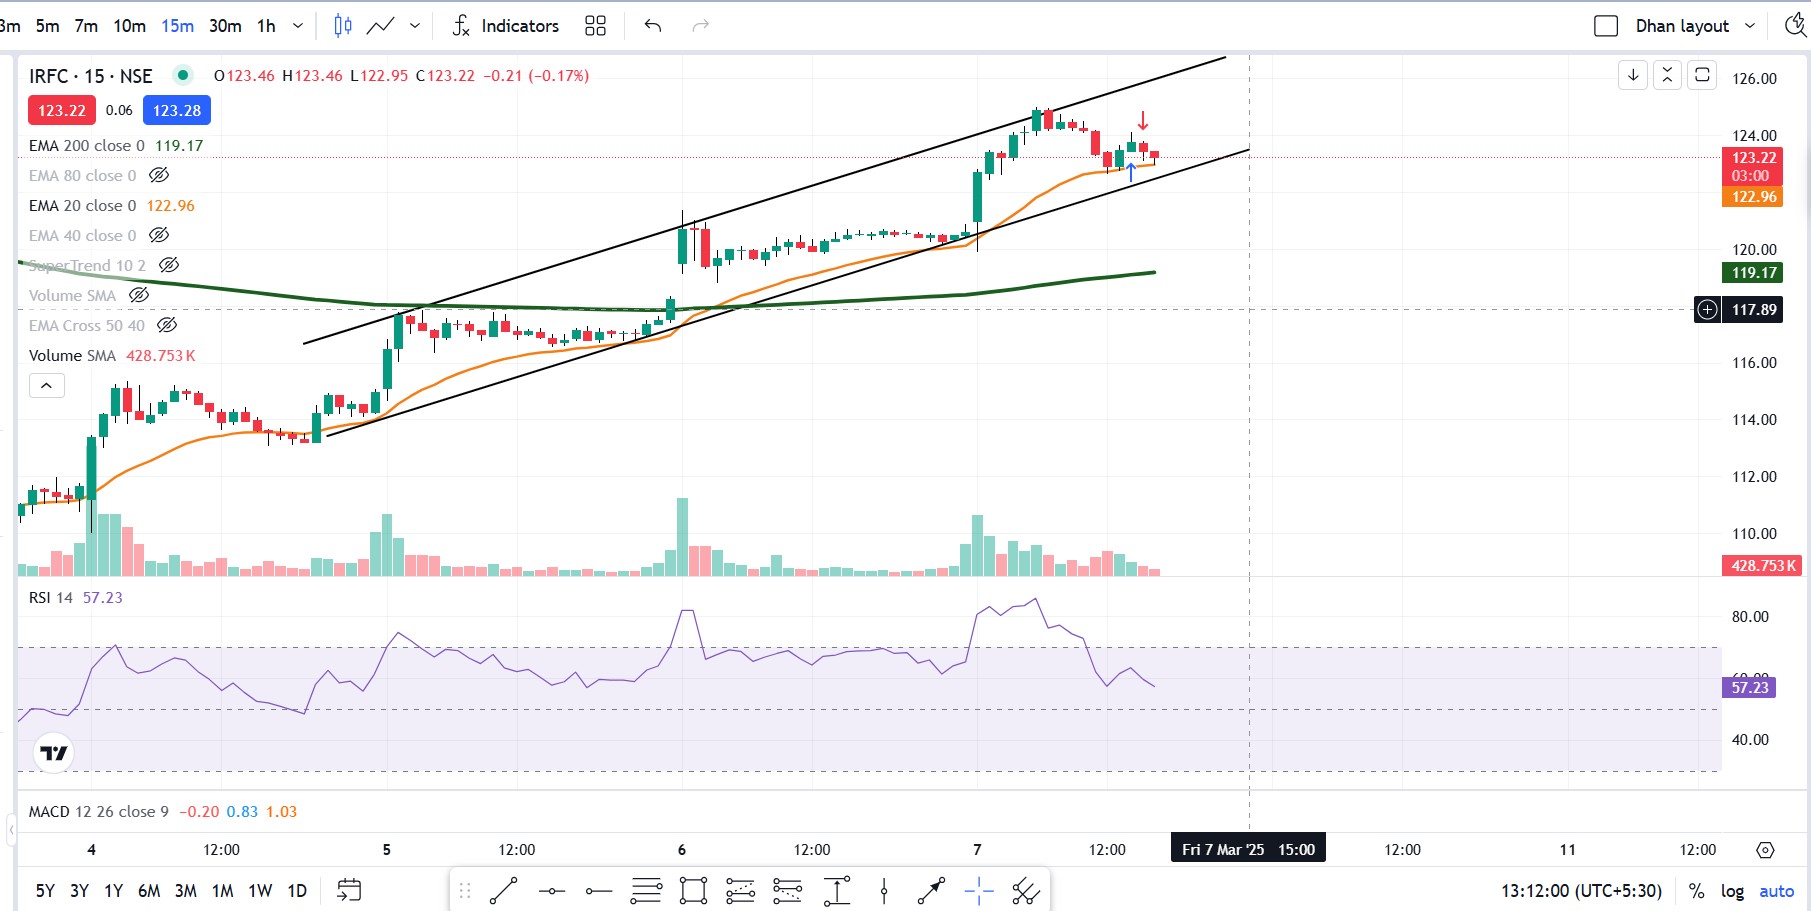
Higher Timeframe (PT)
- Prices are above EMA 200
- Map prices with EMA in PT
- As long as prices stay above EMA in PT, the stock is trending up
Entry Timeframe (CT)
- Map EMA on price in CT
- Wait for price to create a resistance in CT
- Do not trade if there is a regular bearish divergence
- Noise handling is a must
- Use EMA 200 and trendline
- Use SACT and price action
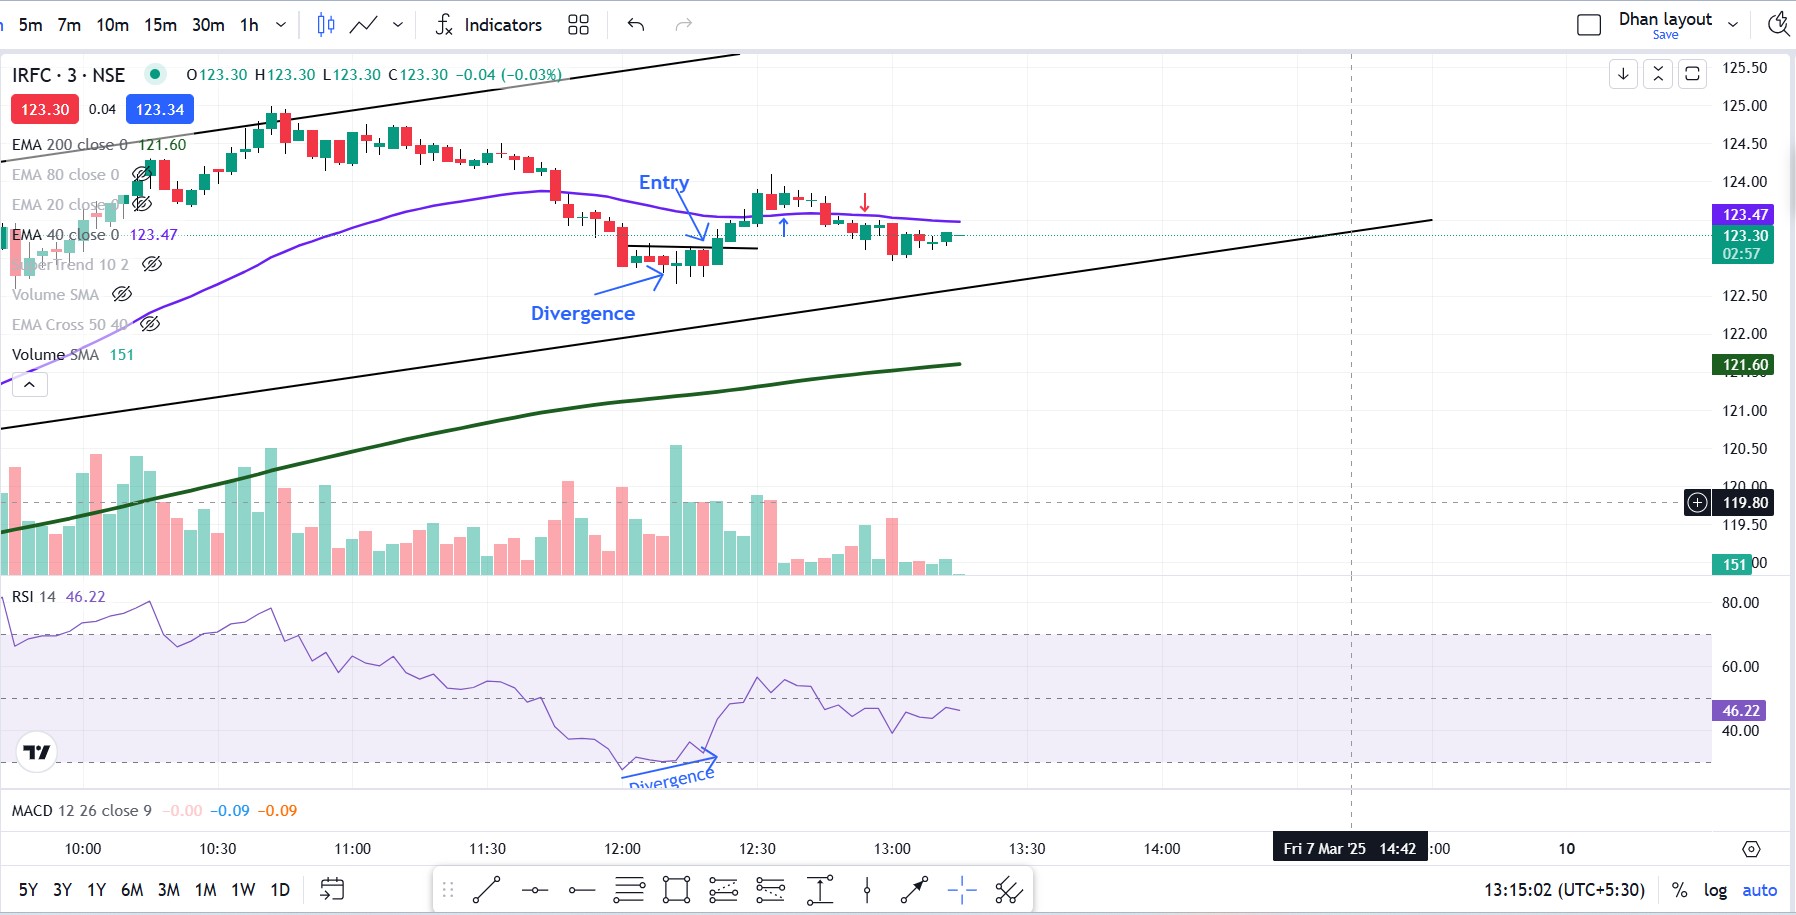
Scenario 3: Divergence in CT
Higher Timeframe (PT)
- Prices are above EMA 200
- Map prices with EMA in PT
- As long as prices stay above EMA in PT, the stock is trending up
- Do not trade if there is a regular bearish divergence
Entry Timeframe (CT)
- Wait for divergence in CT
- Look for a W pattern
- Look for break of divergence
- Confirm with price action
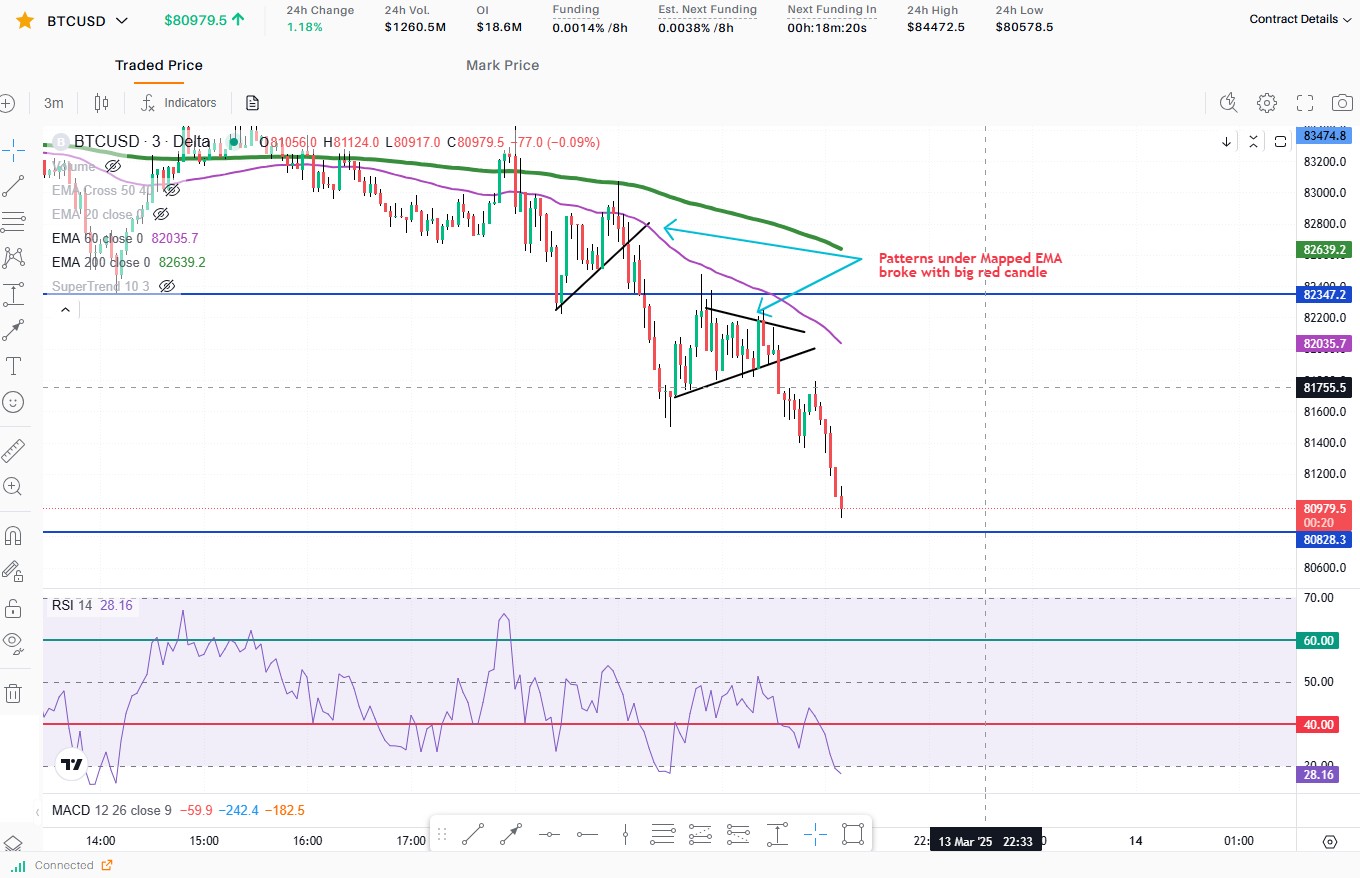
Scenario 4: Patterns in CT
Higher Timeframe (PT)
- Prices are above or below EMA 200 in PT
- Map prices with EMA in PT
Entry Timeframe (CT)
- Map prices with EMA in CT
- Look for pattern break with a big candle and volume
- Pattern should be below EMA 200 even if it is against trend in CT
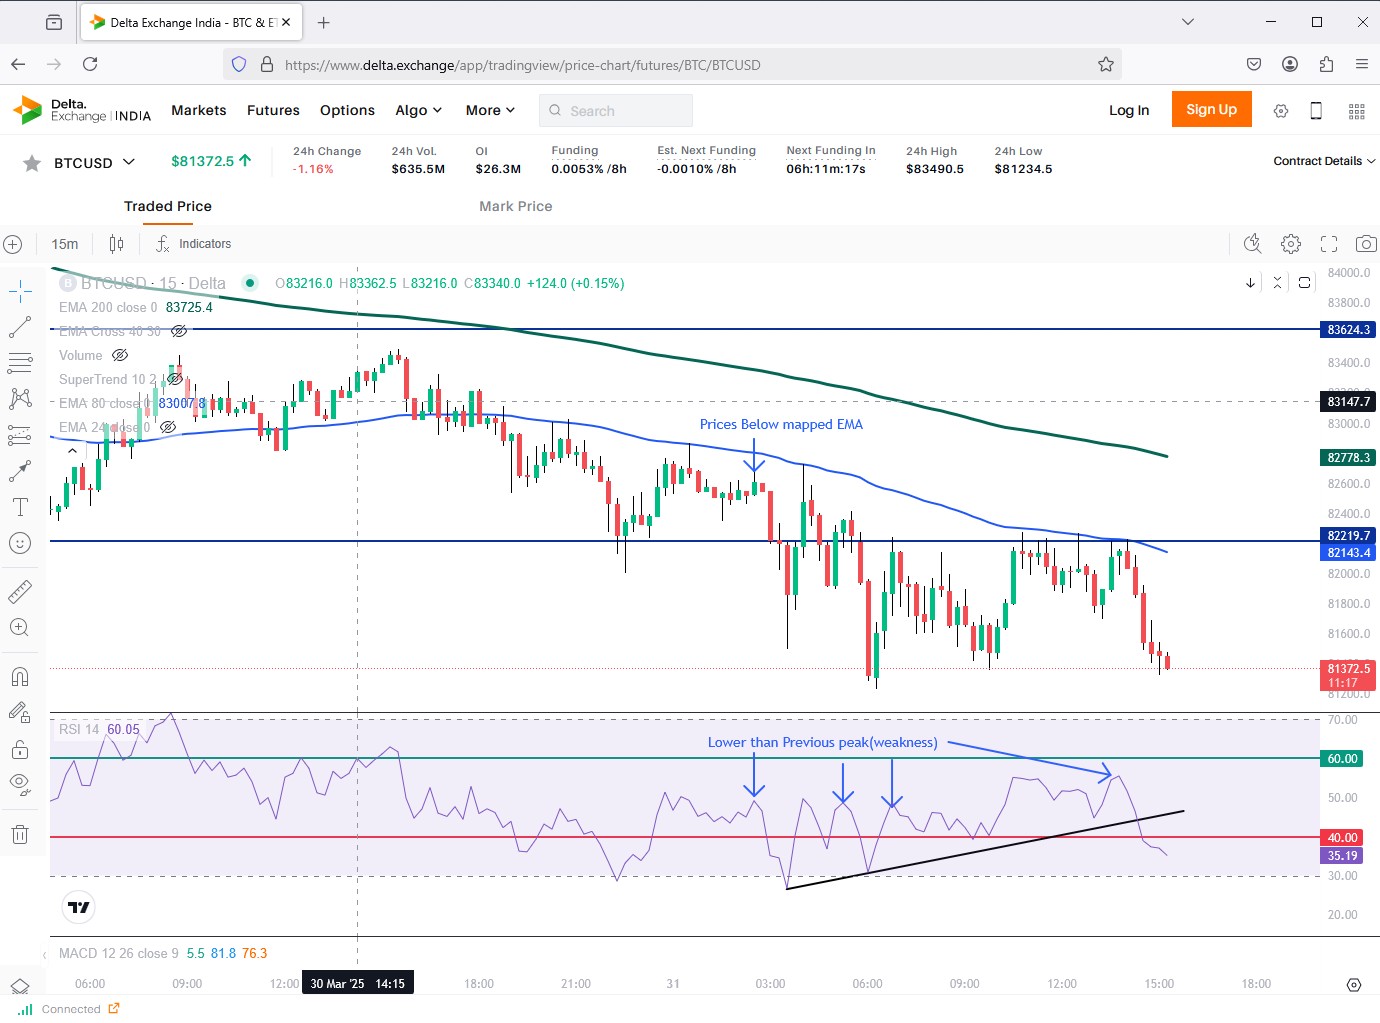
Scenario 5: EMA + RSI
Higher Timeframe (PT)
- Prices are above or below EMA 200 in PT
- Prices are below EMA 200 in PT
- Current peak is lower than the previous peak
Entry Timeframe (CT)
- Look for EMA bounce
- Look for candlestick pattern
- Look for pattern below EMA
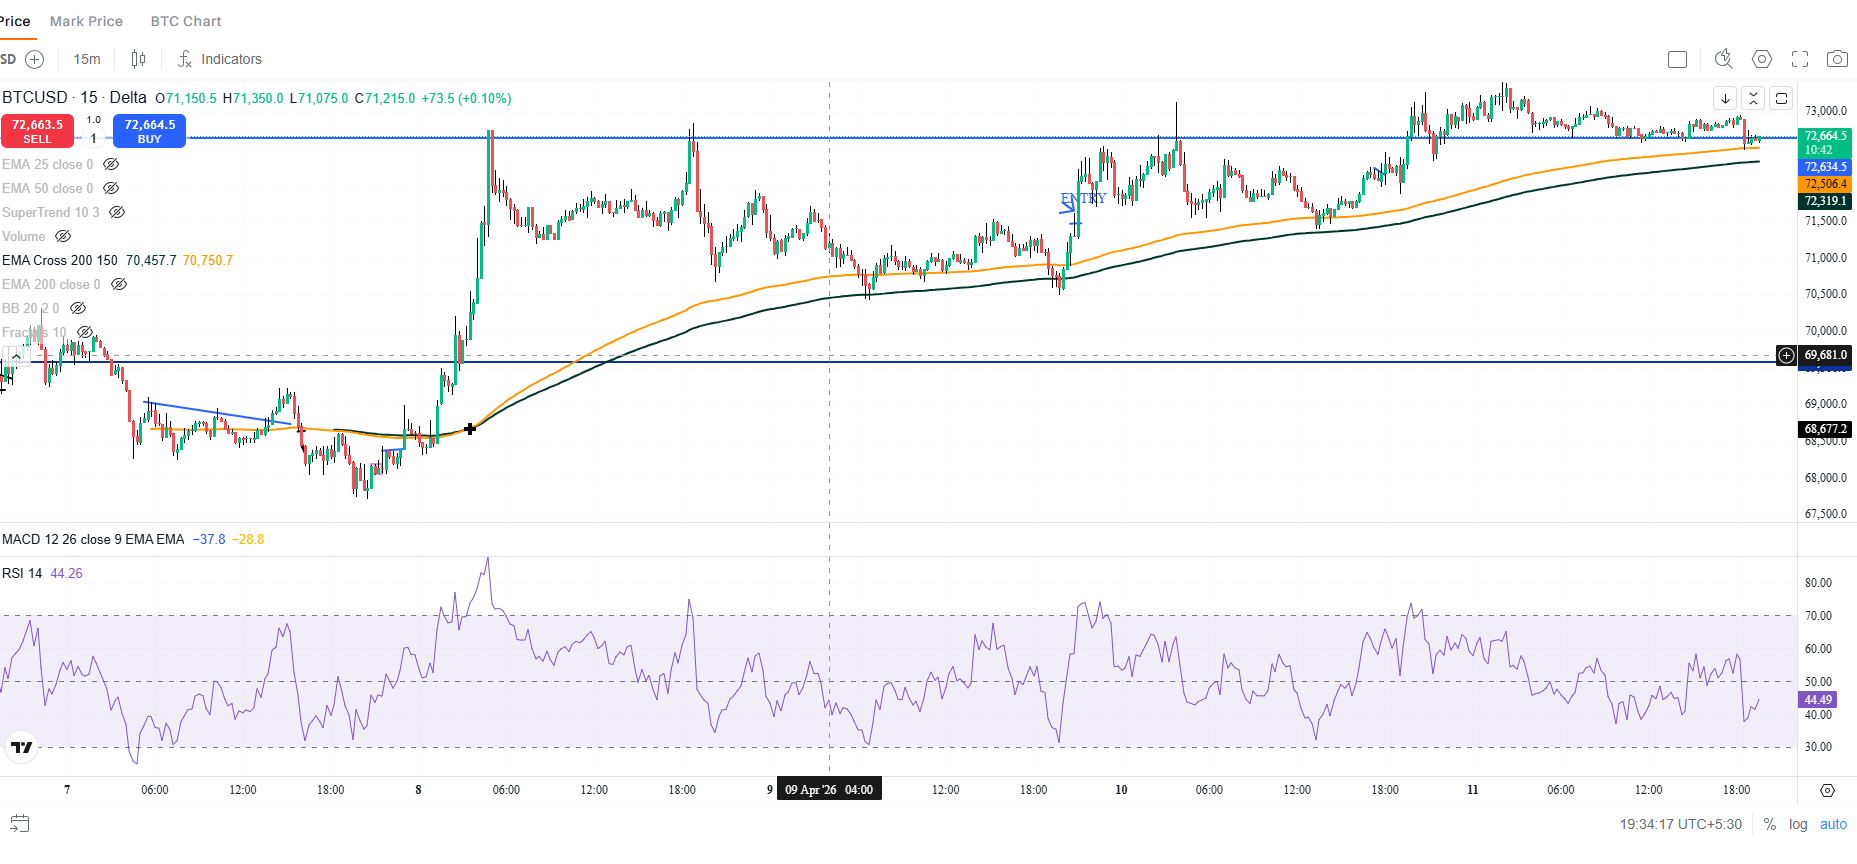
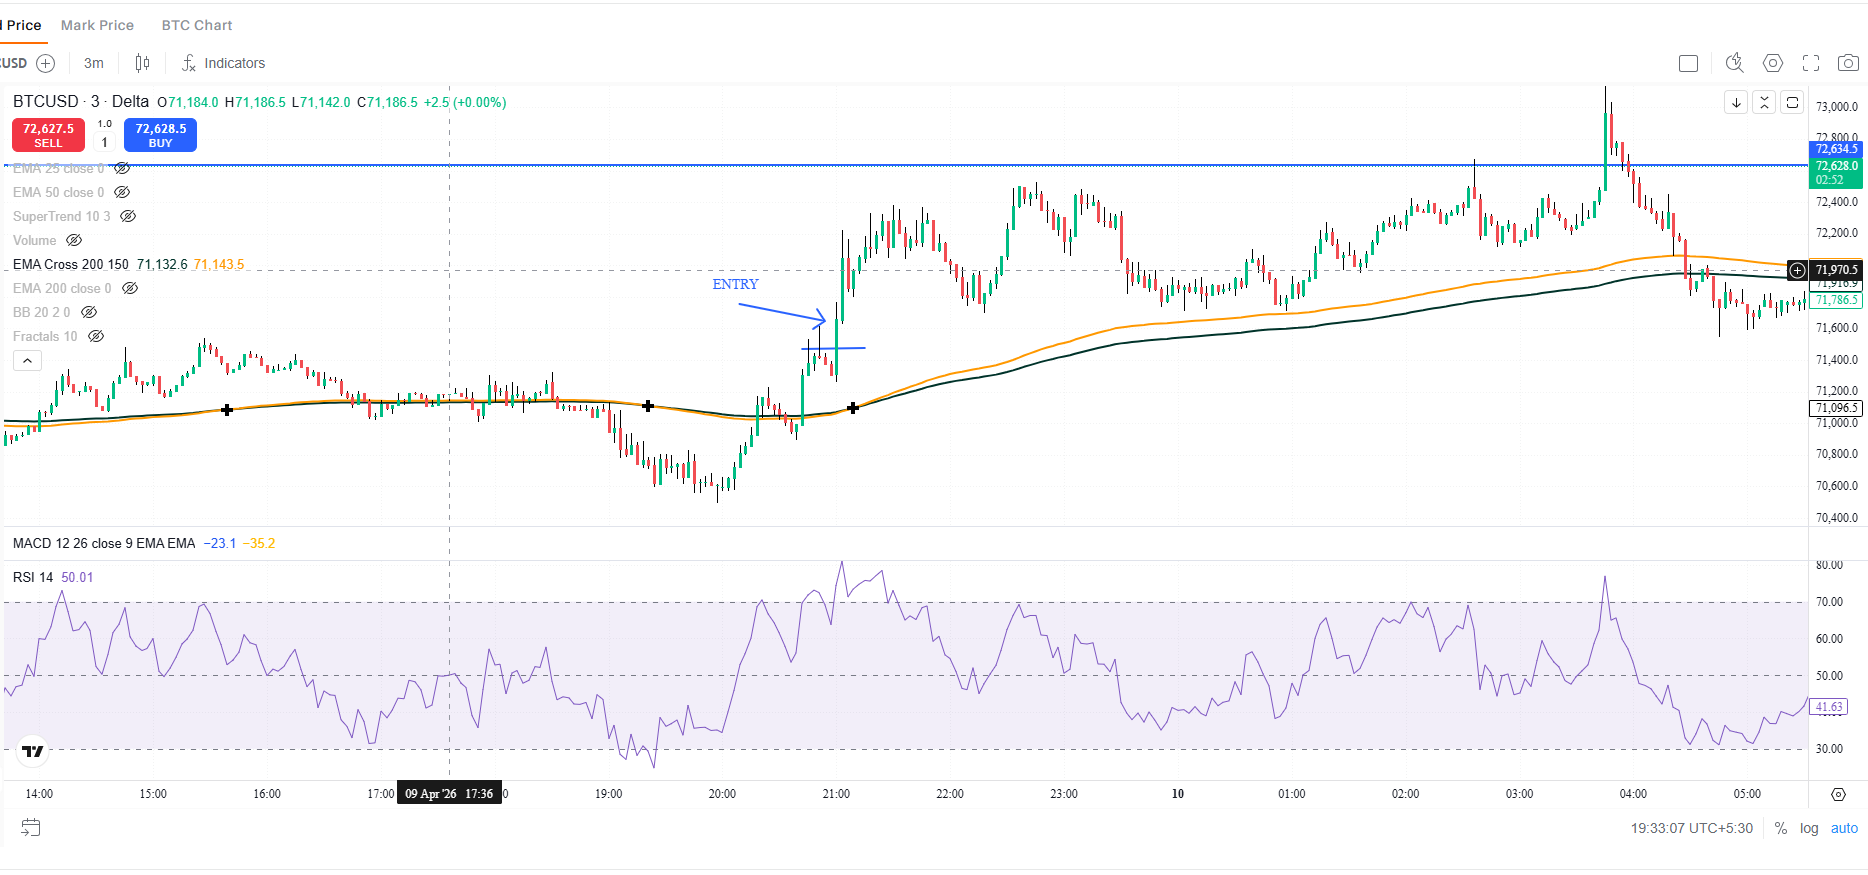
EMA 200 Bounce - Uptrend
Higher Timeframe (PT)
- Bullish crossover 150/200
- Prices are in up trend
Entry Timeframe (CT)
- Price move above 200
- Creates a pattern without touching the EMA 200
- Noise Handling for Resistance break