Important Rule
- RSI should exibhit regular divergence
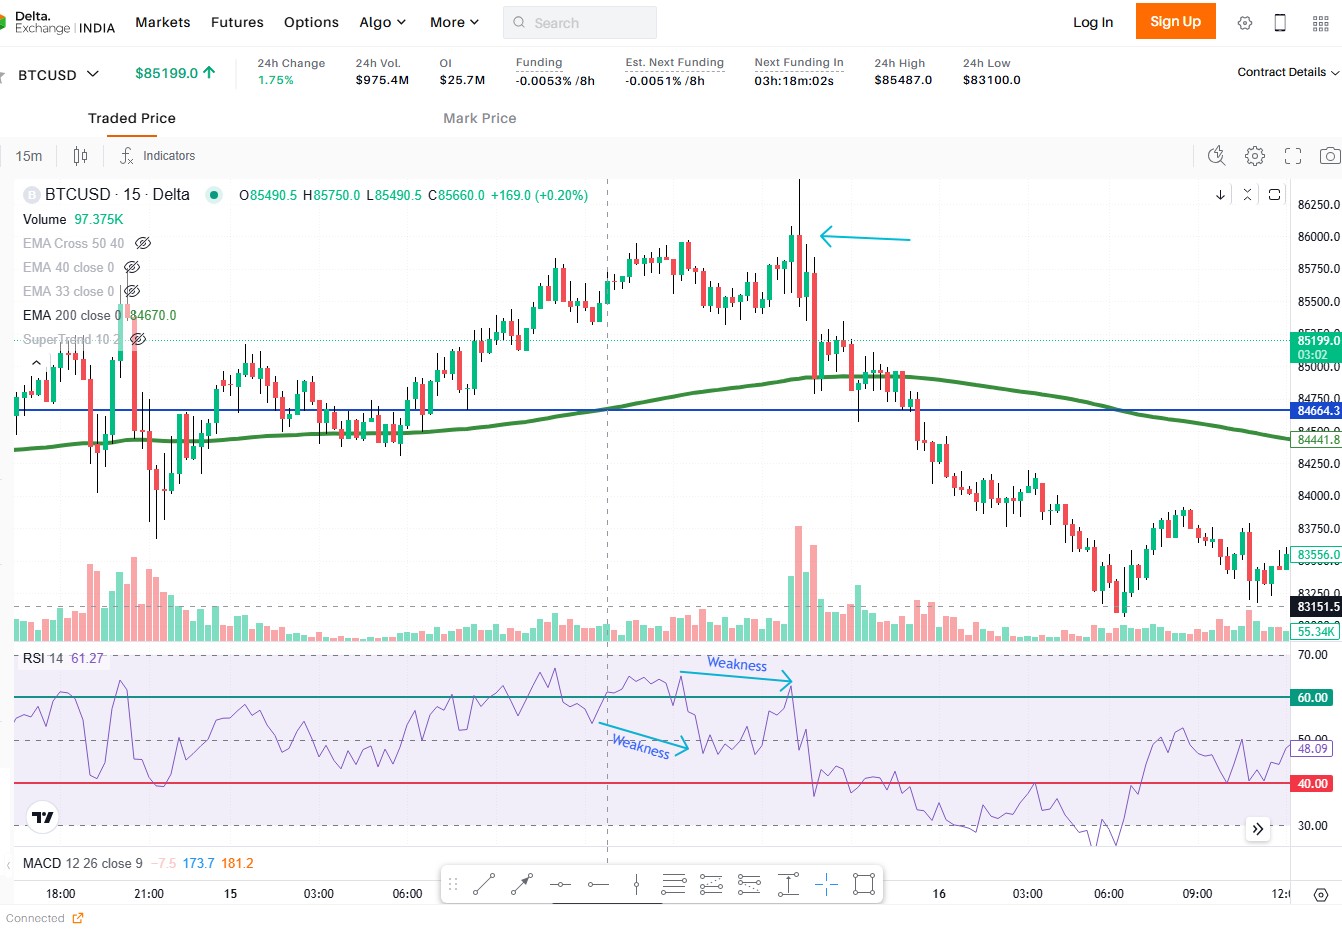
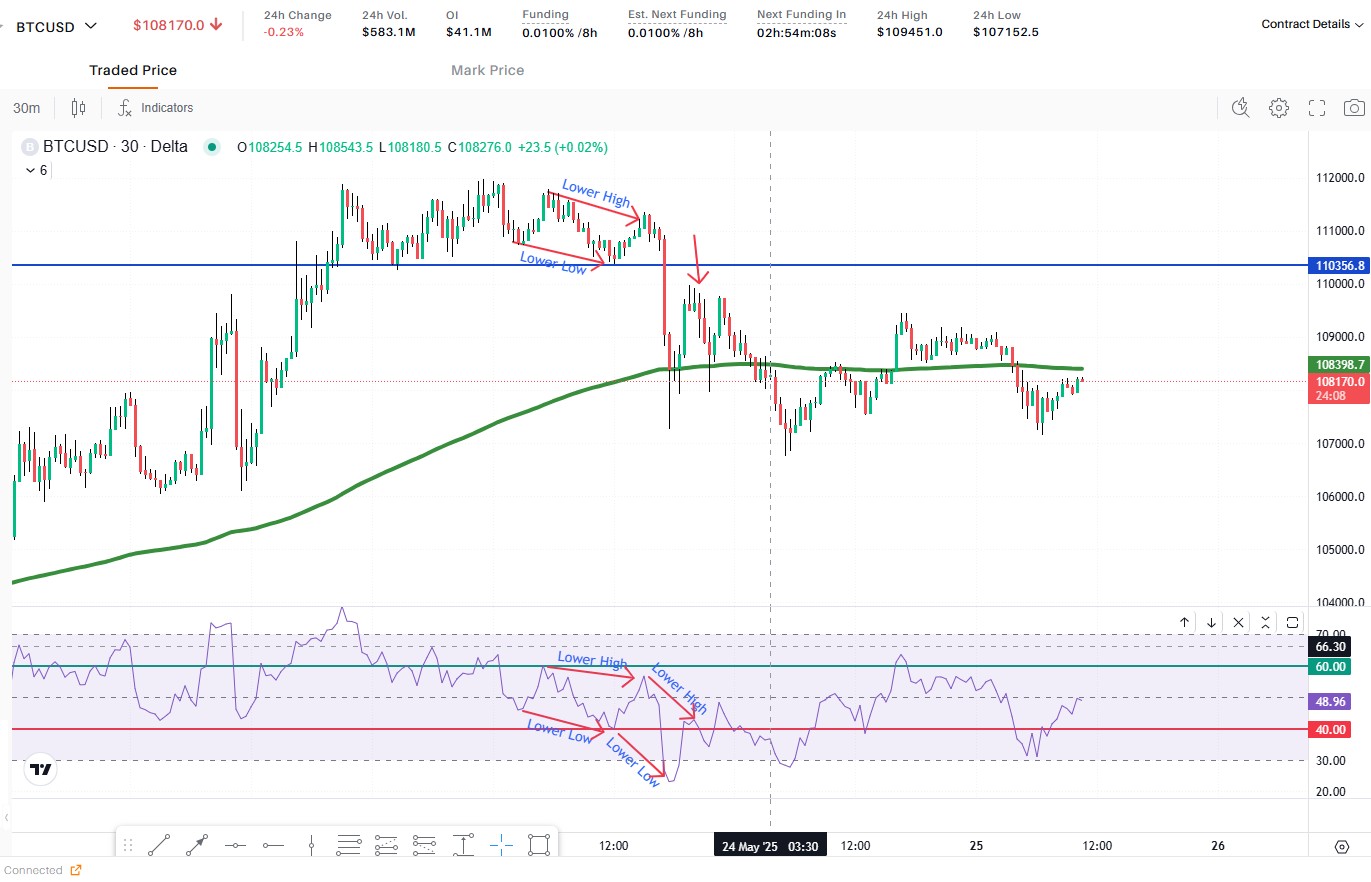
- Opposite Direction Trade - Uptrend
- RSI should break the previous low showing weakness in PT
- Current peak should be lower than previous peak in PT
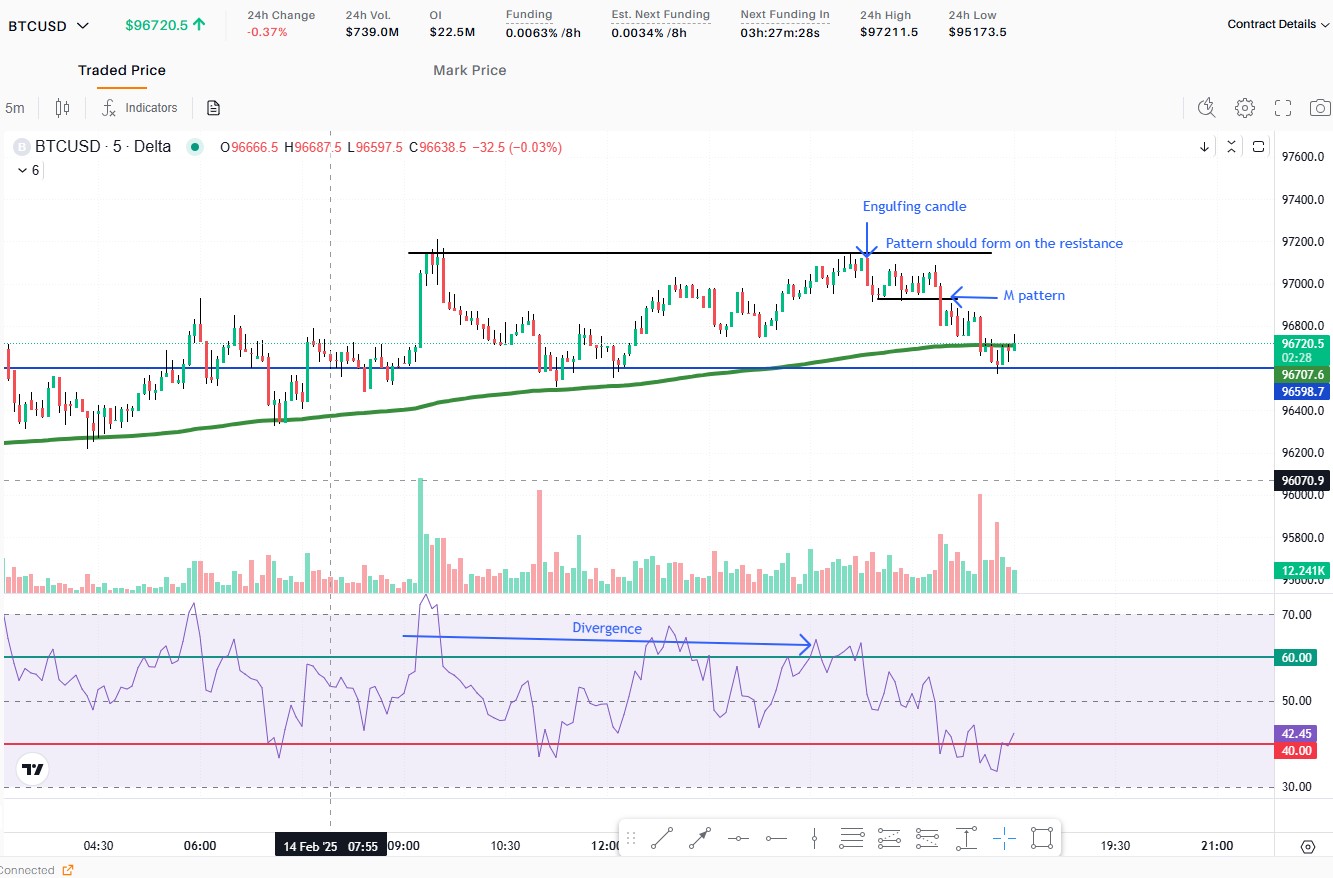
- In CT look for M pattern
- Opposite Direction Trade - Downtrend
- RSI should break the previous high showing strength in PT
- Current low should be higher than previous low in PT
- Candlestick pattern should form above RSI 40 in uptrend
- In CT look for M pattern
Divergence + Candlestick
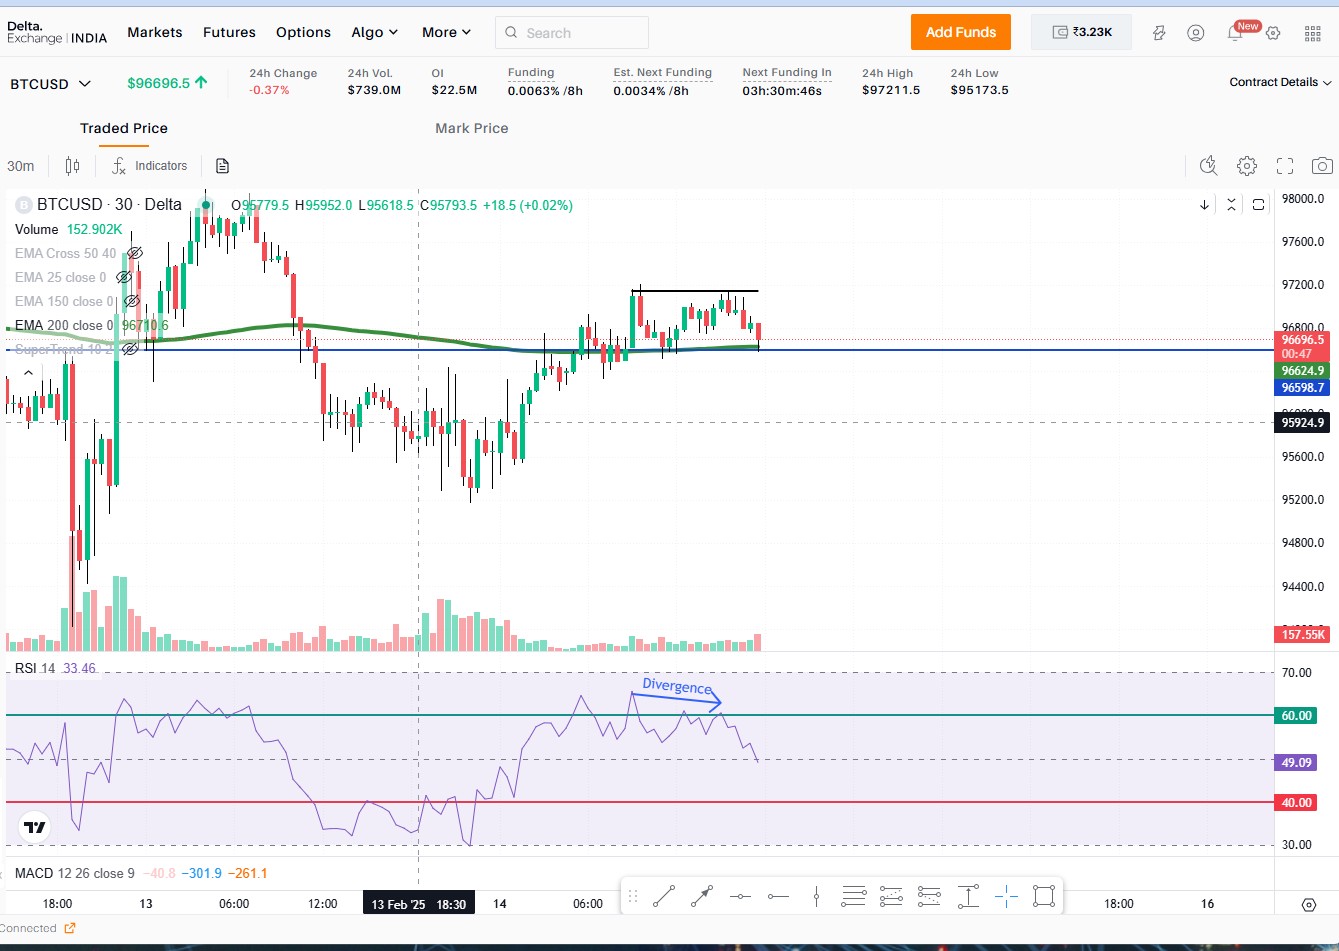
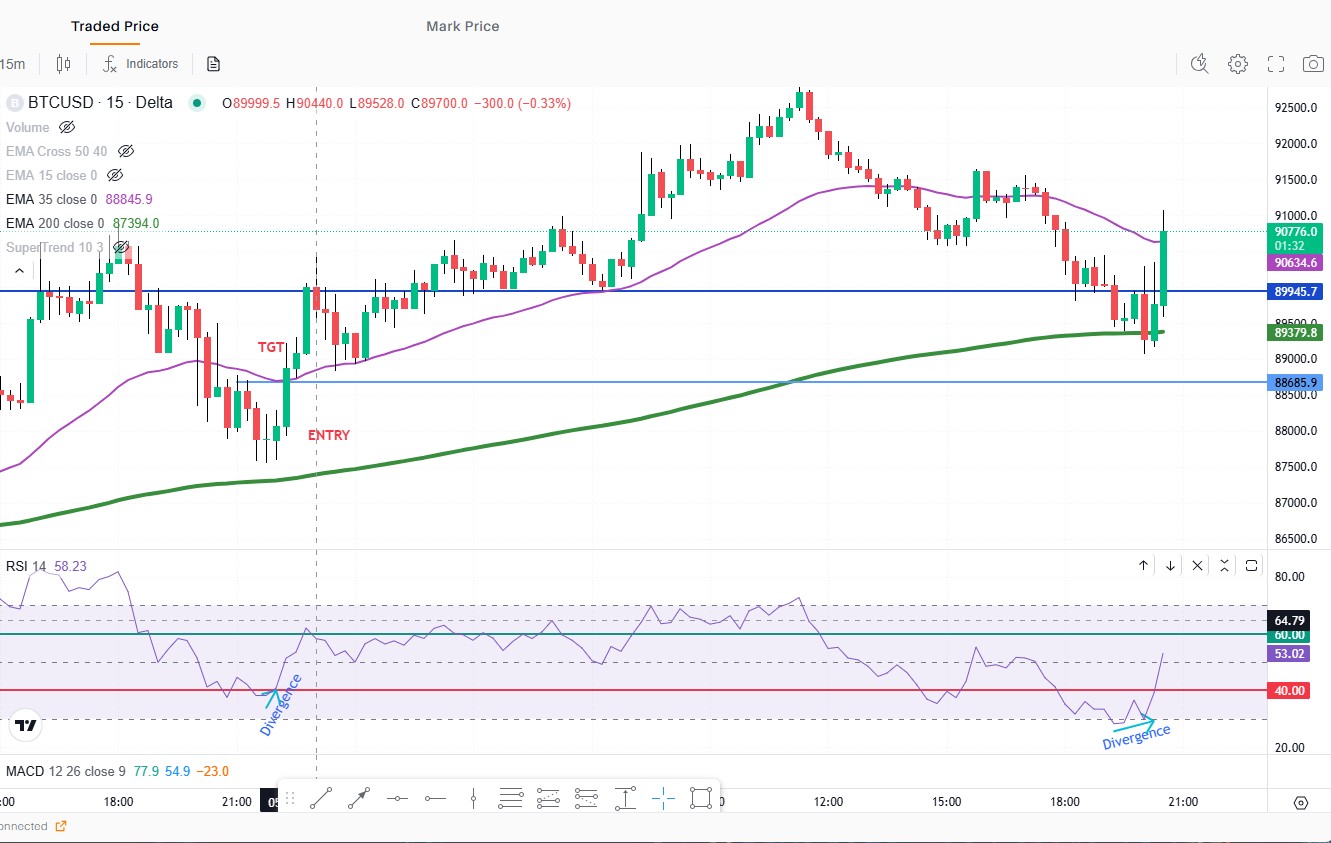
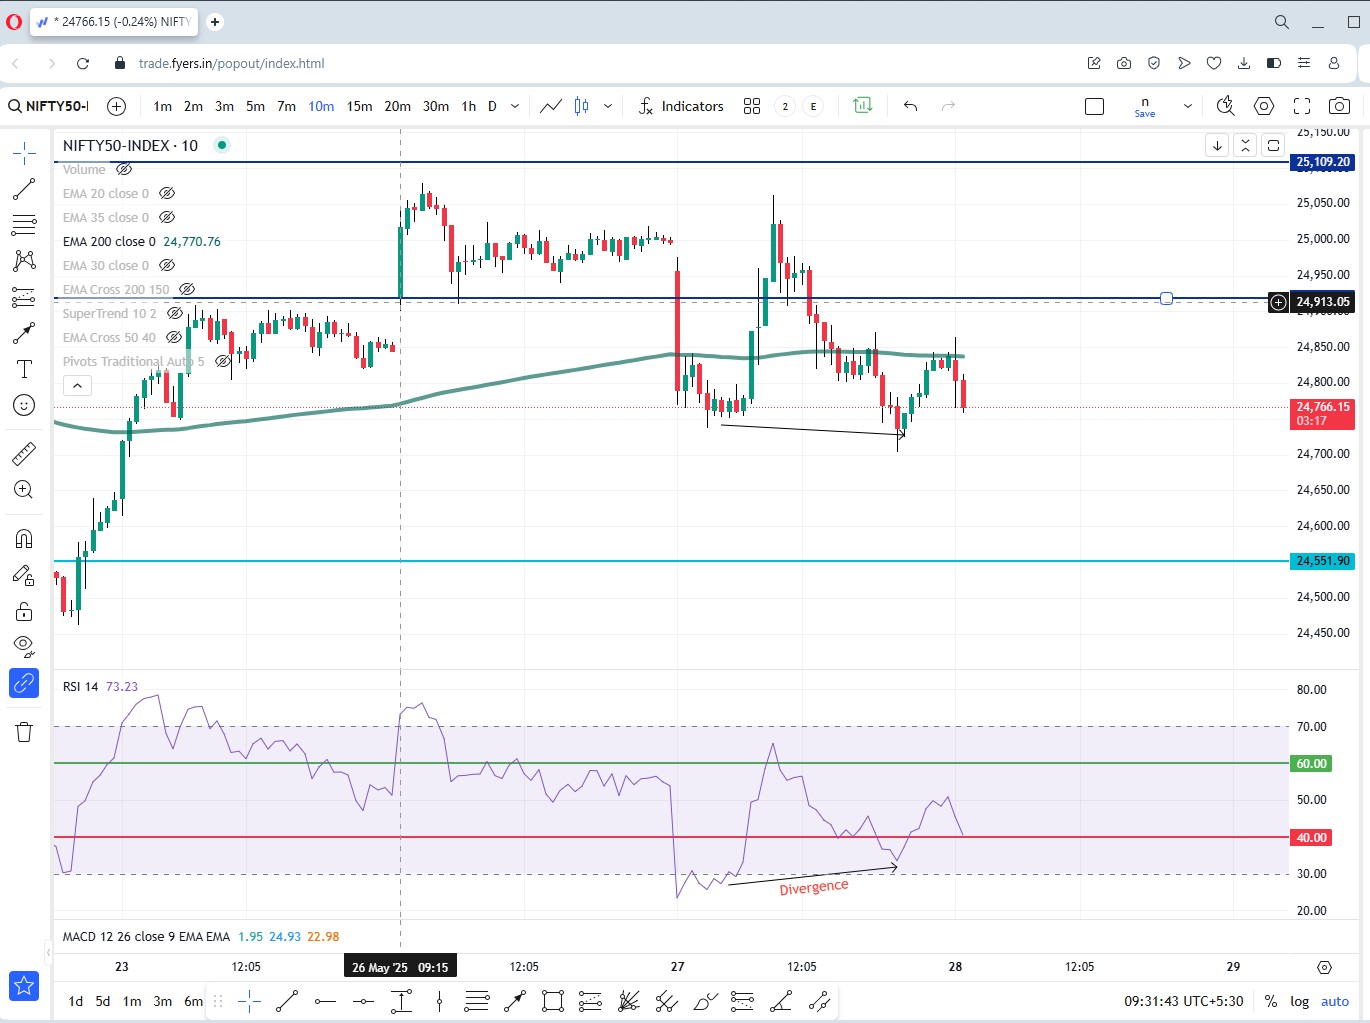
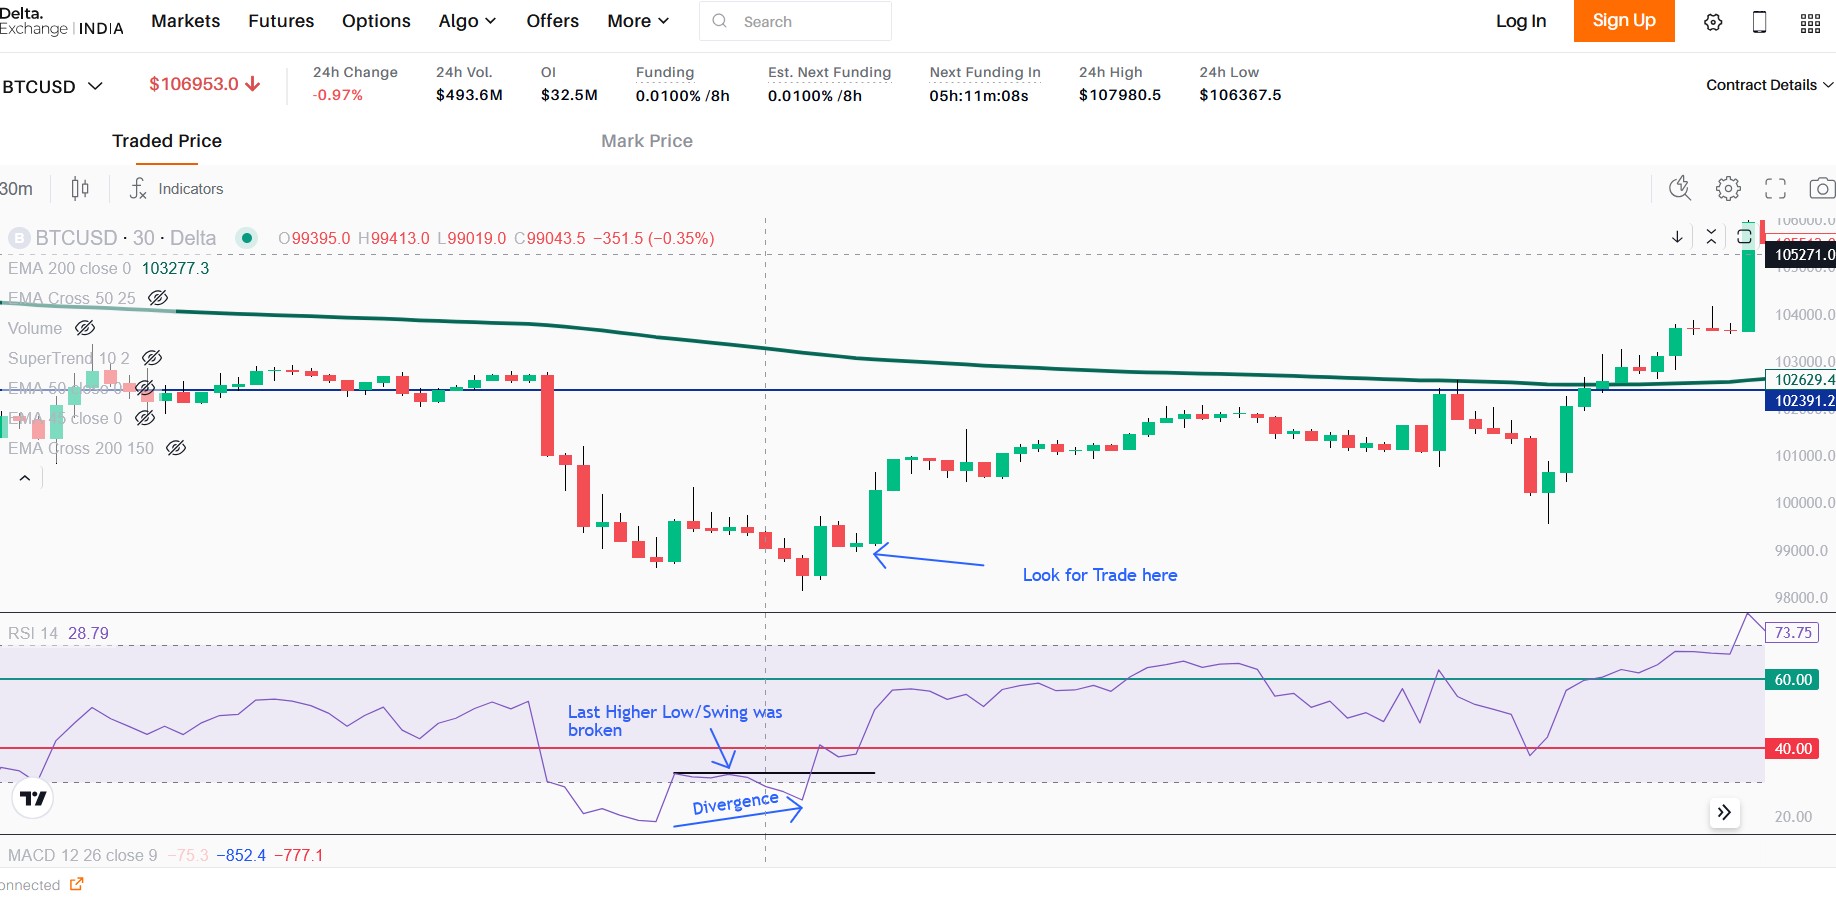
Scenario 1: Uptrend: Divergence
- Prices are above EMA 200 in PT
- Divergence in RSI in PT( RSI below 60 is preferred )
- Always draw a trendline, Divergence top/bottom should be near or form after the break
- Draw area of Resistance in PT
- In CT look for candlestick pattern
- Candlestick pattern should form above RSI 40 in CT
- Target is nearest support
Example 1
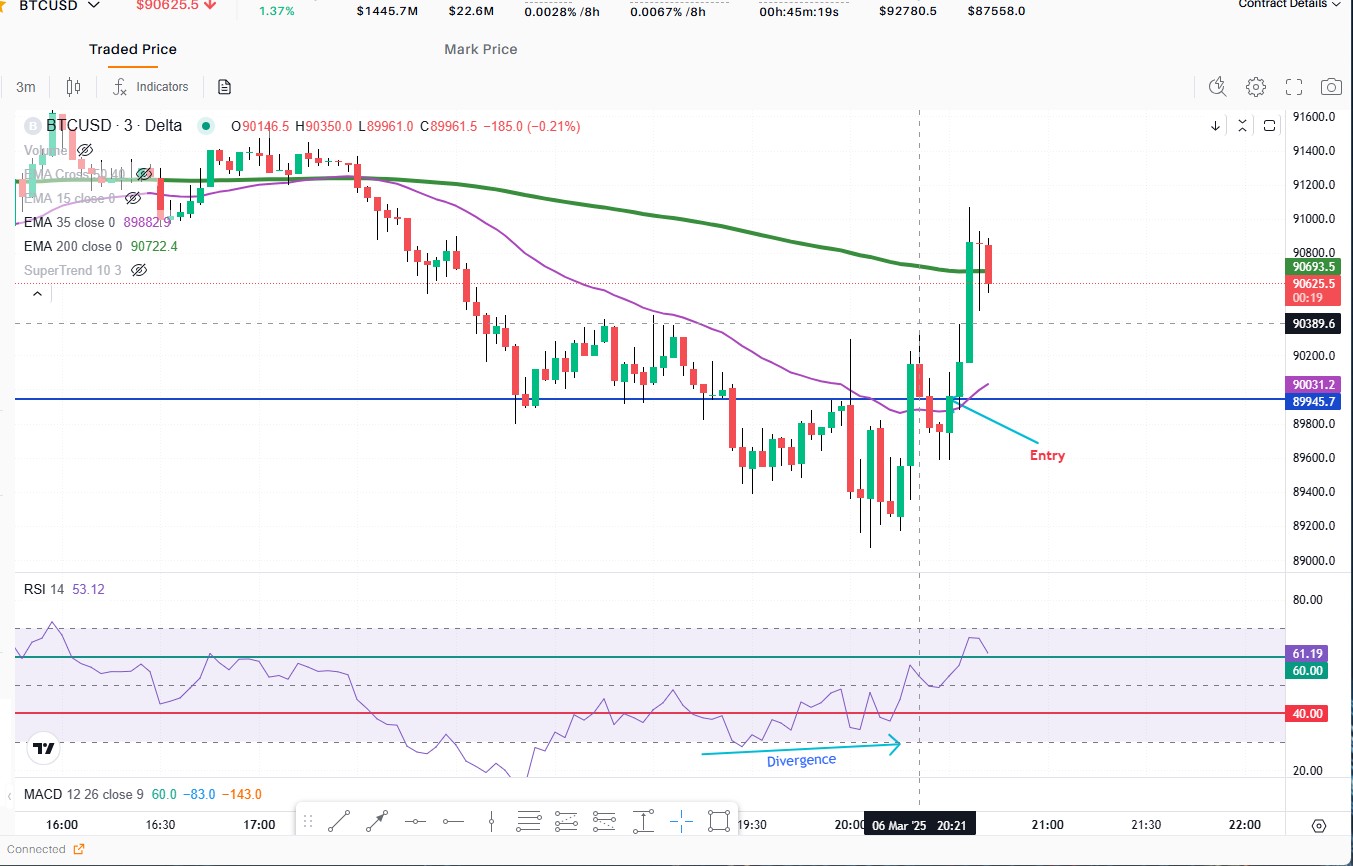
Example 2
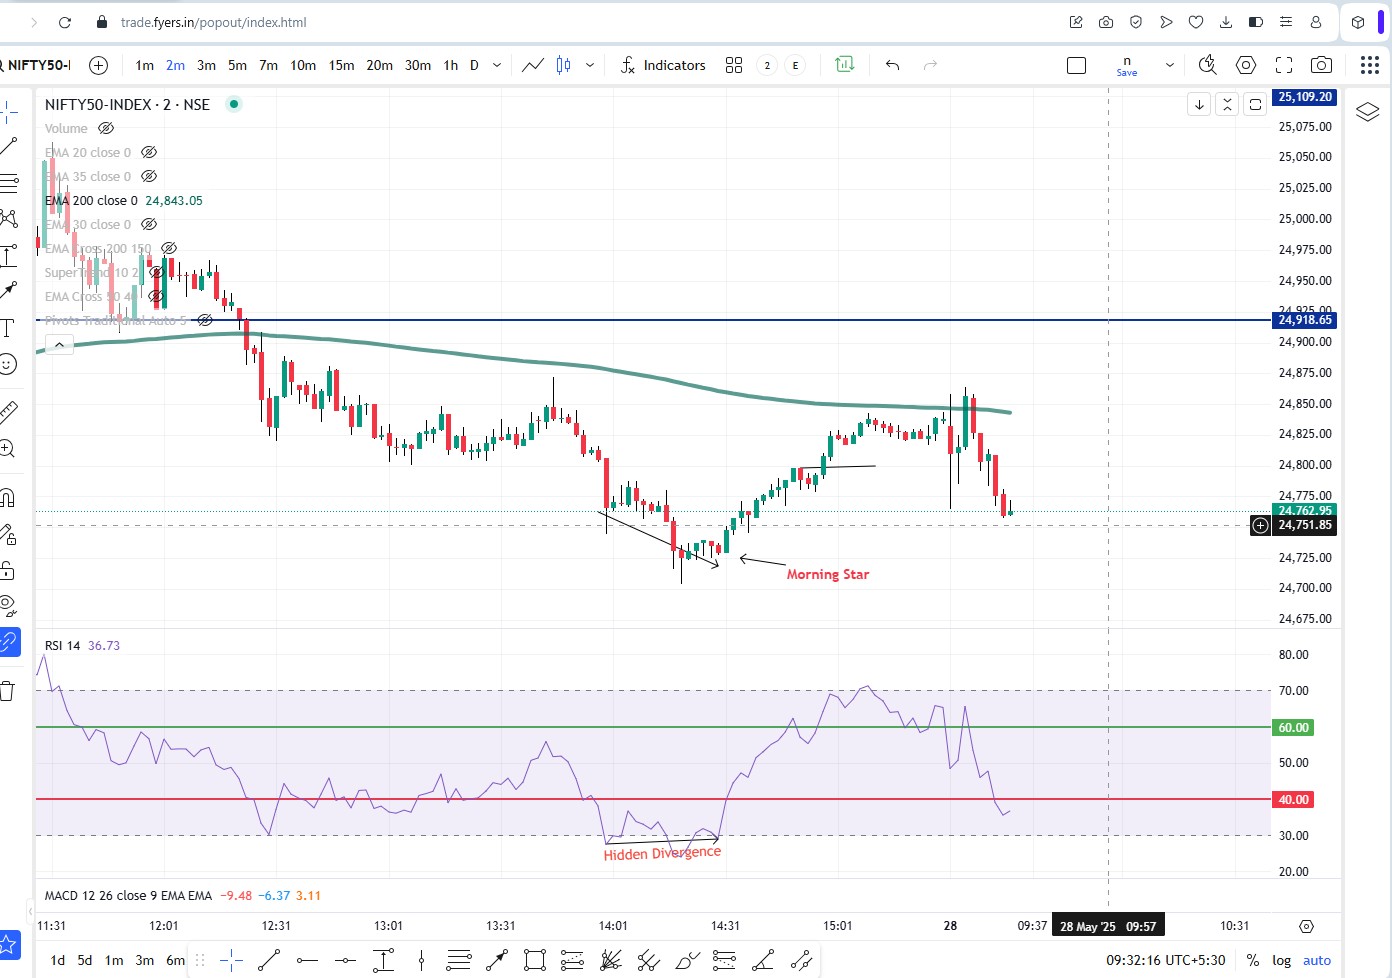
Scenario 2: Uptrend: Divergence on ema 200 and on RSI 30
- Prices are touching EMA 200 in PT
- Divergence on RSI 30
- In CT look for W pattern or EMA+Trendline
- Target is nearest support
Scenario 3: Uptrend: Divergence in Grandfather TimeFrame
- Divergence in GTF(e.g. 30 mins)
- Go to CT
- Look for W Double/Trible bottom pattern with divergence
- Entry on break of pattern
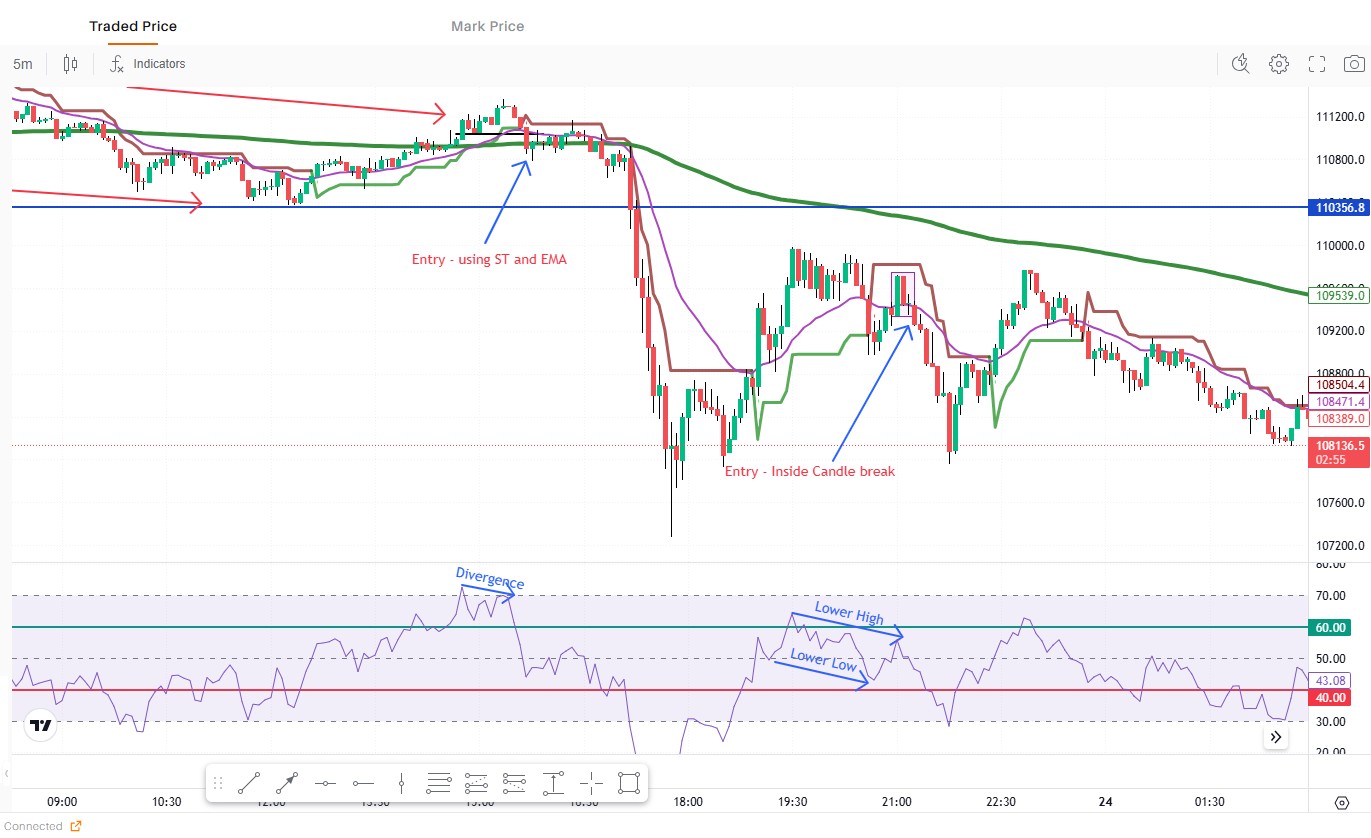
RSI MAGIC
- RSI in Uptrend should exibhit Higher High and Higher Low, In Downtrend - Lower Low and Lower High
- Look for divergence in RSI
- In CT wait for prices to come to hault i.e. It creates a area of Support or Resistance or a divergence
- In CT look for candlestick pattern, EMA+Trendline , SACT
- For candlestick pattern Entry in CT
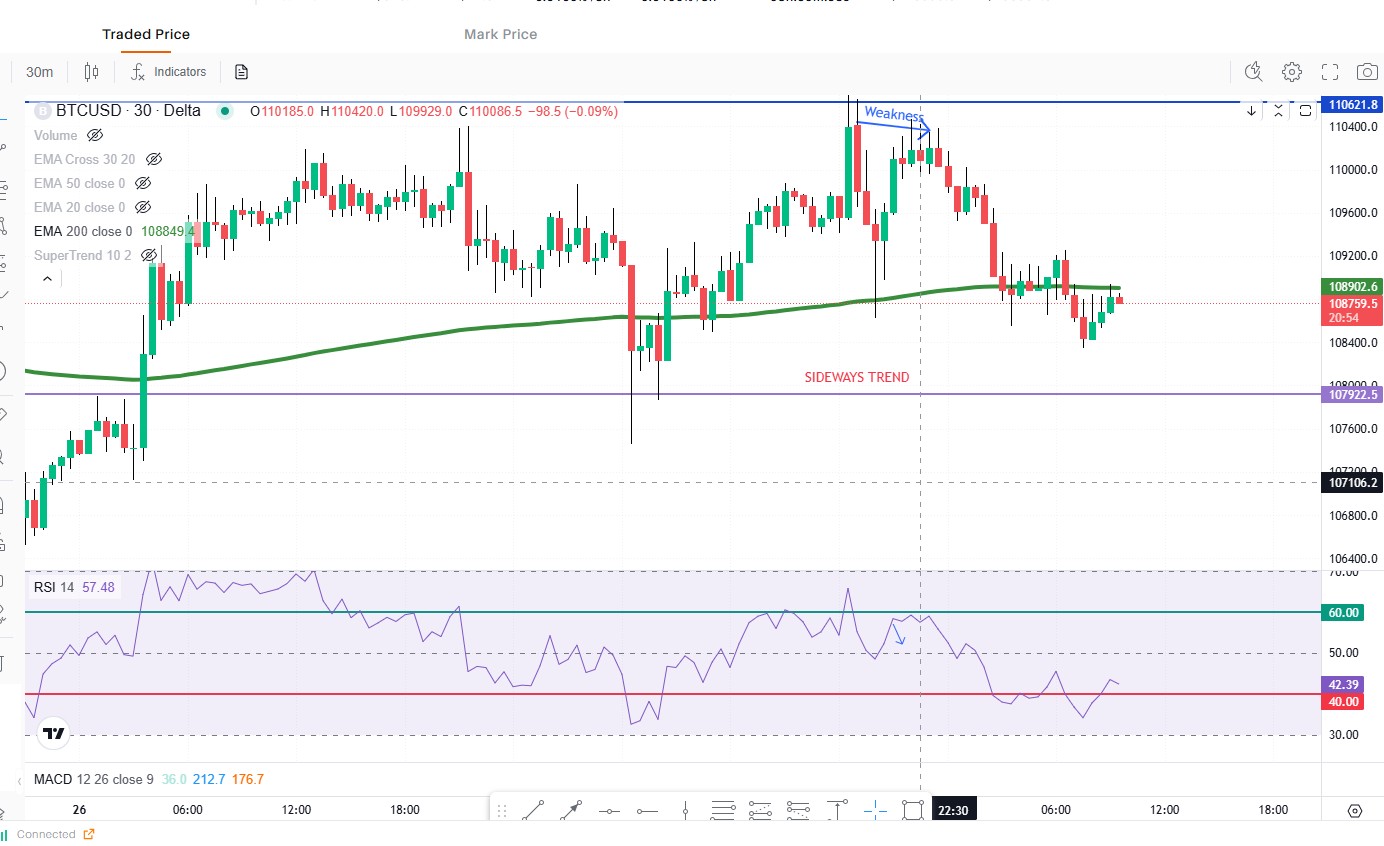
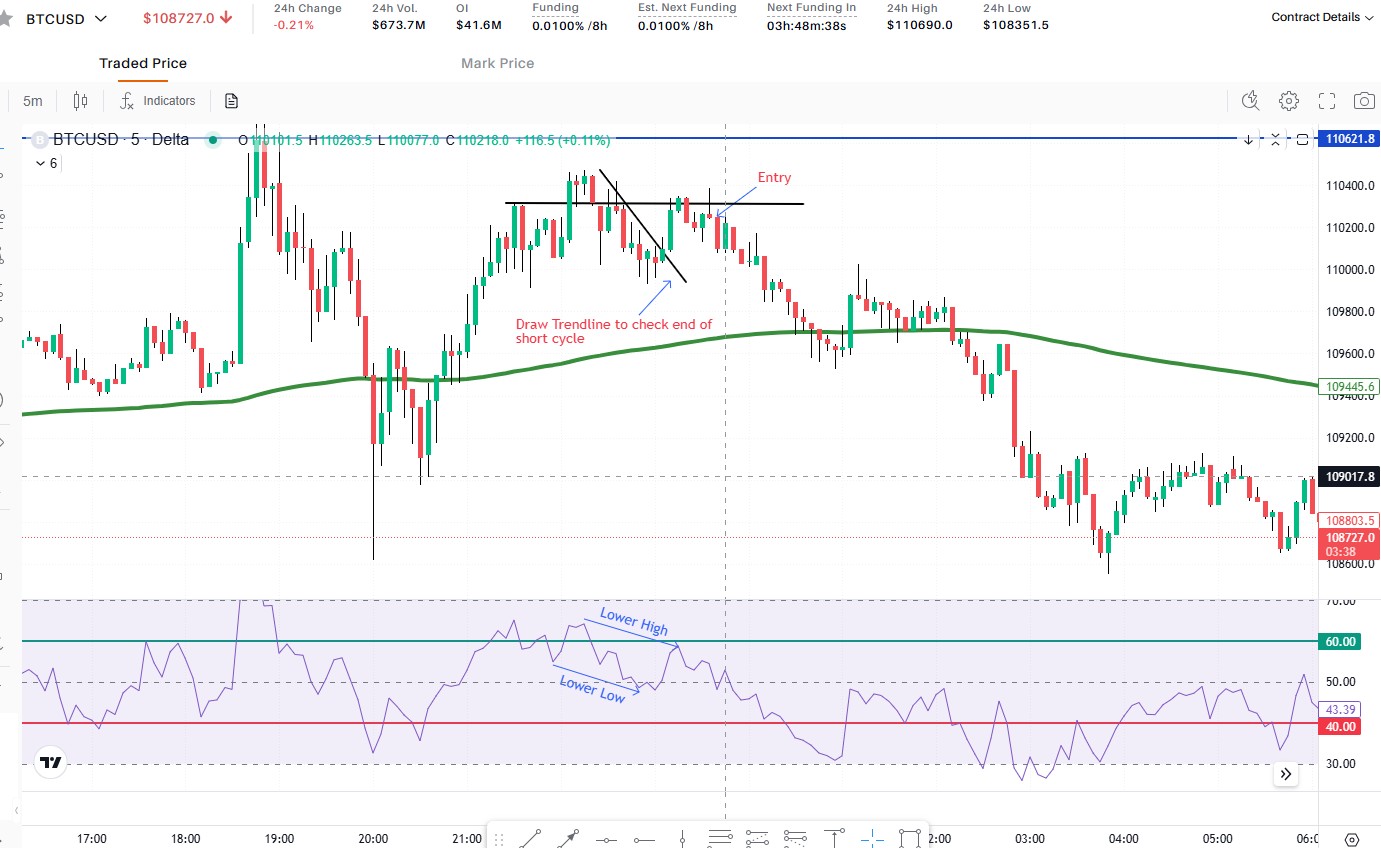
- If 2 tops are created then look for Divergence or Hidden Divergence
- If 3 tops look for Lower Low and Lower High formation on RSI
- Draw trendline on short cycles of tops/bottoms
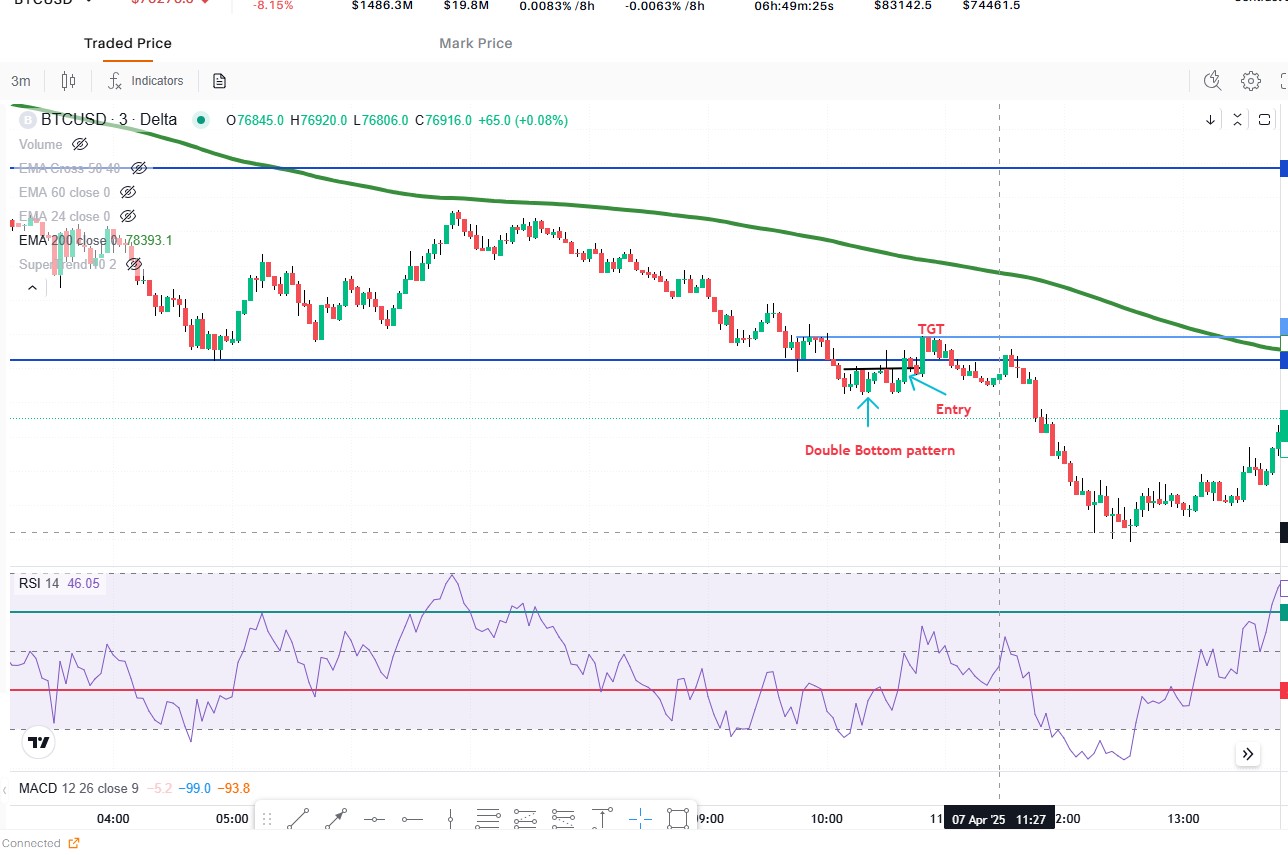
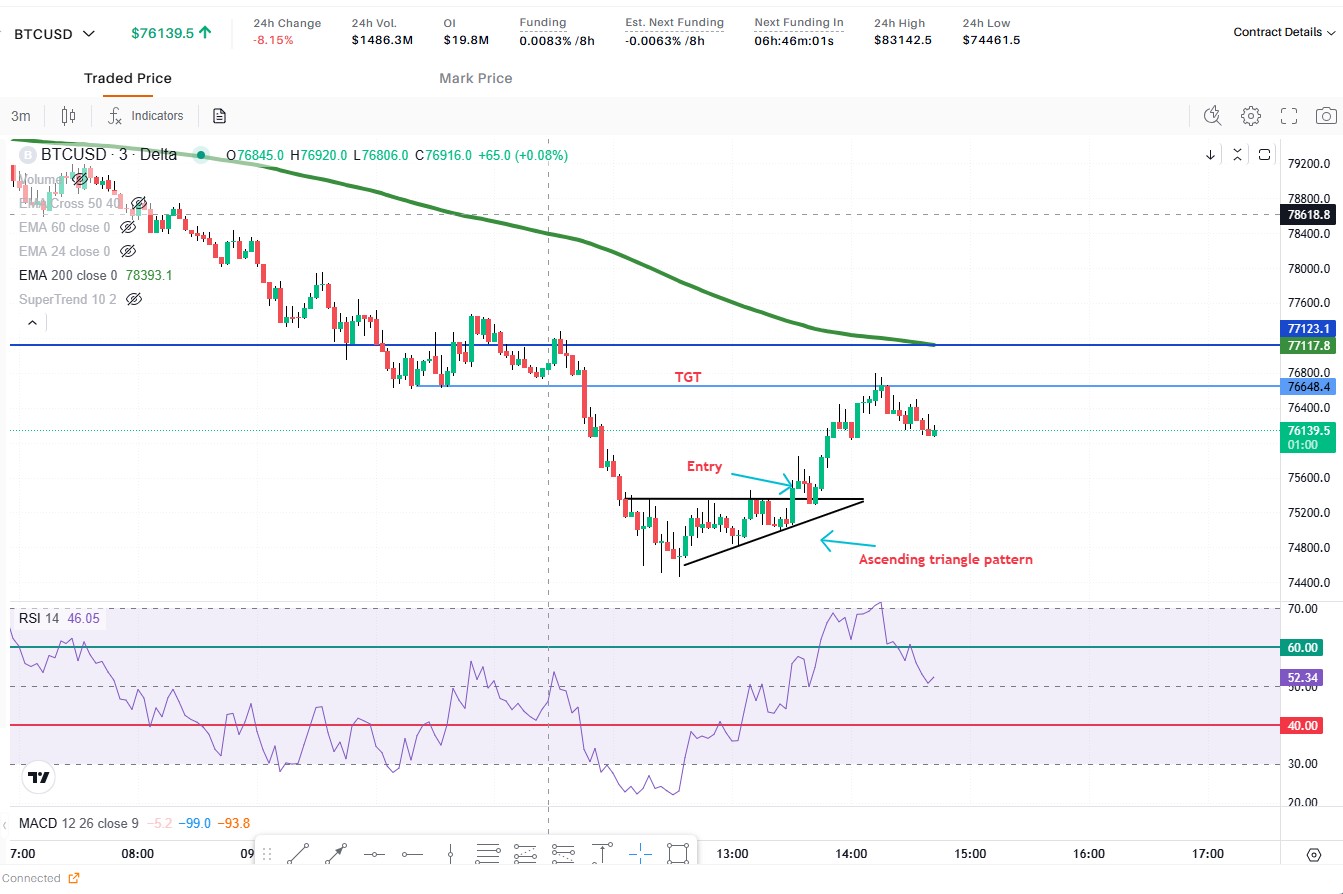
Example - 2 Bottoms
Example - 3 Tops
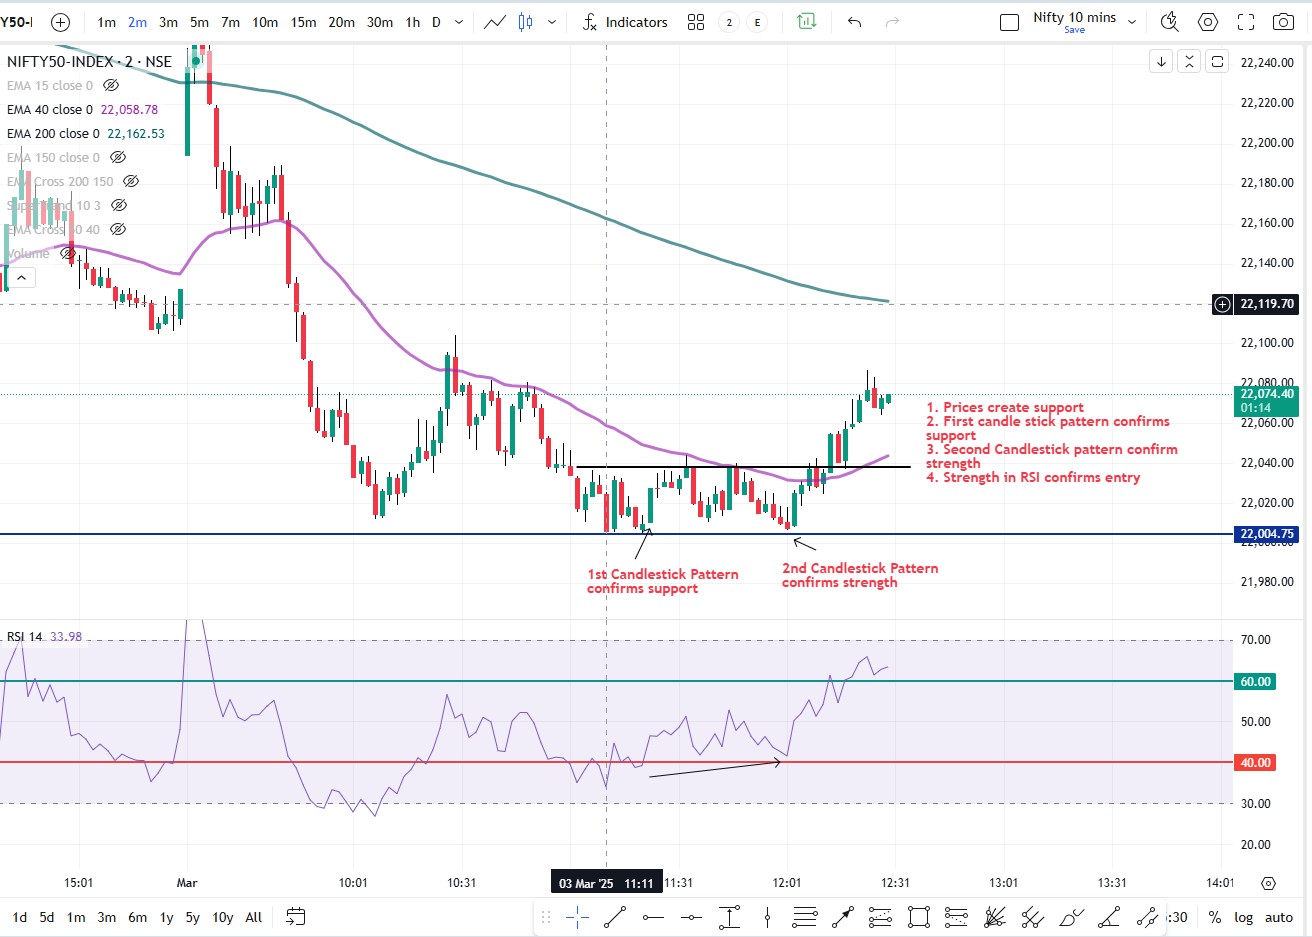
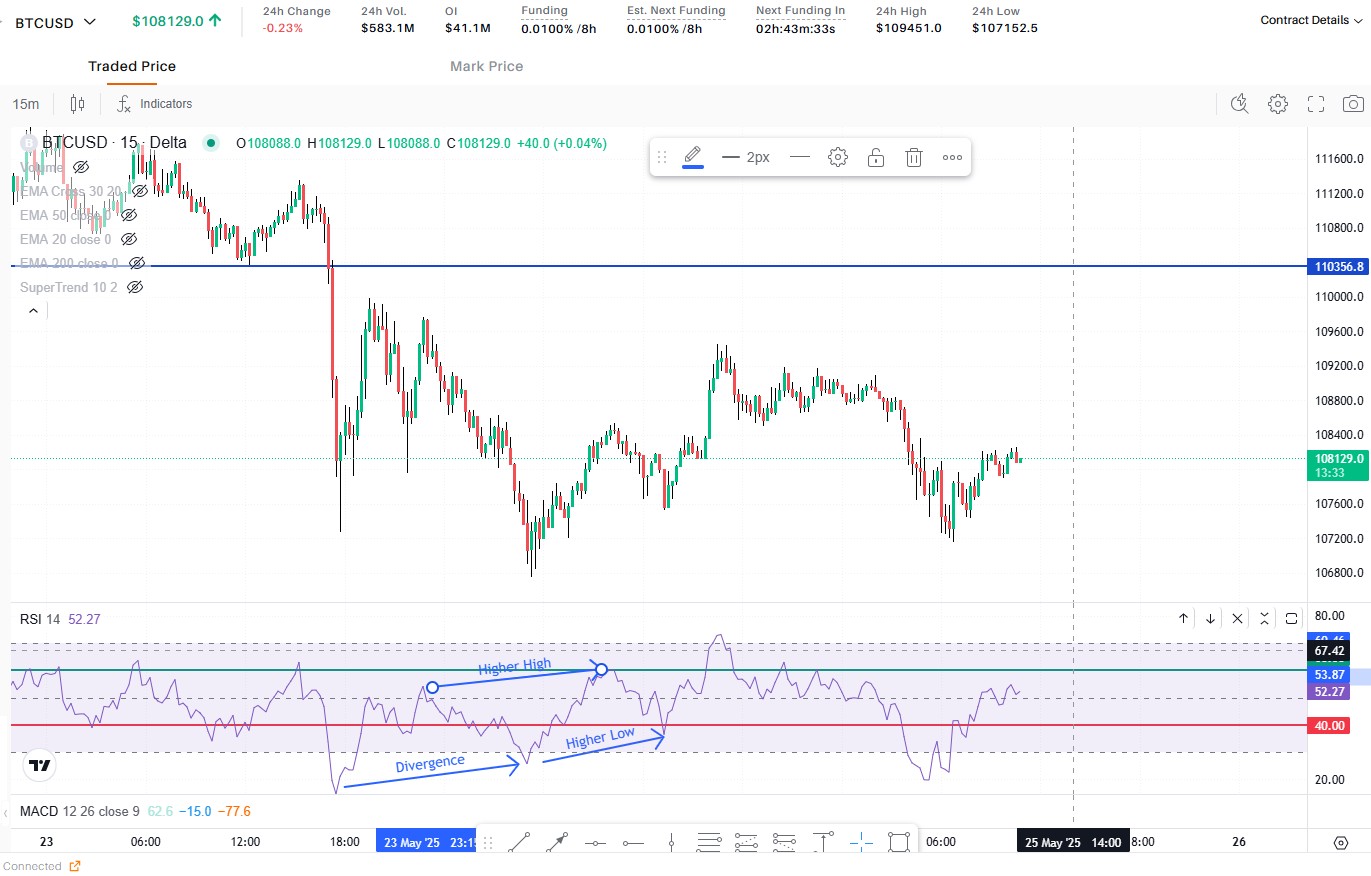
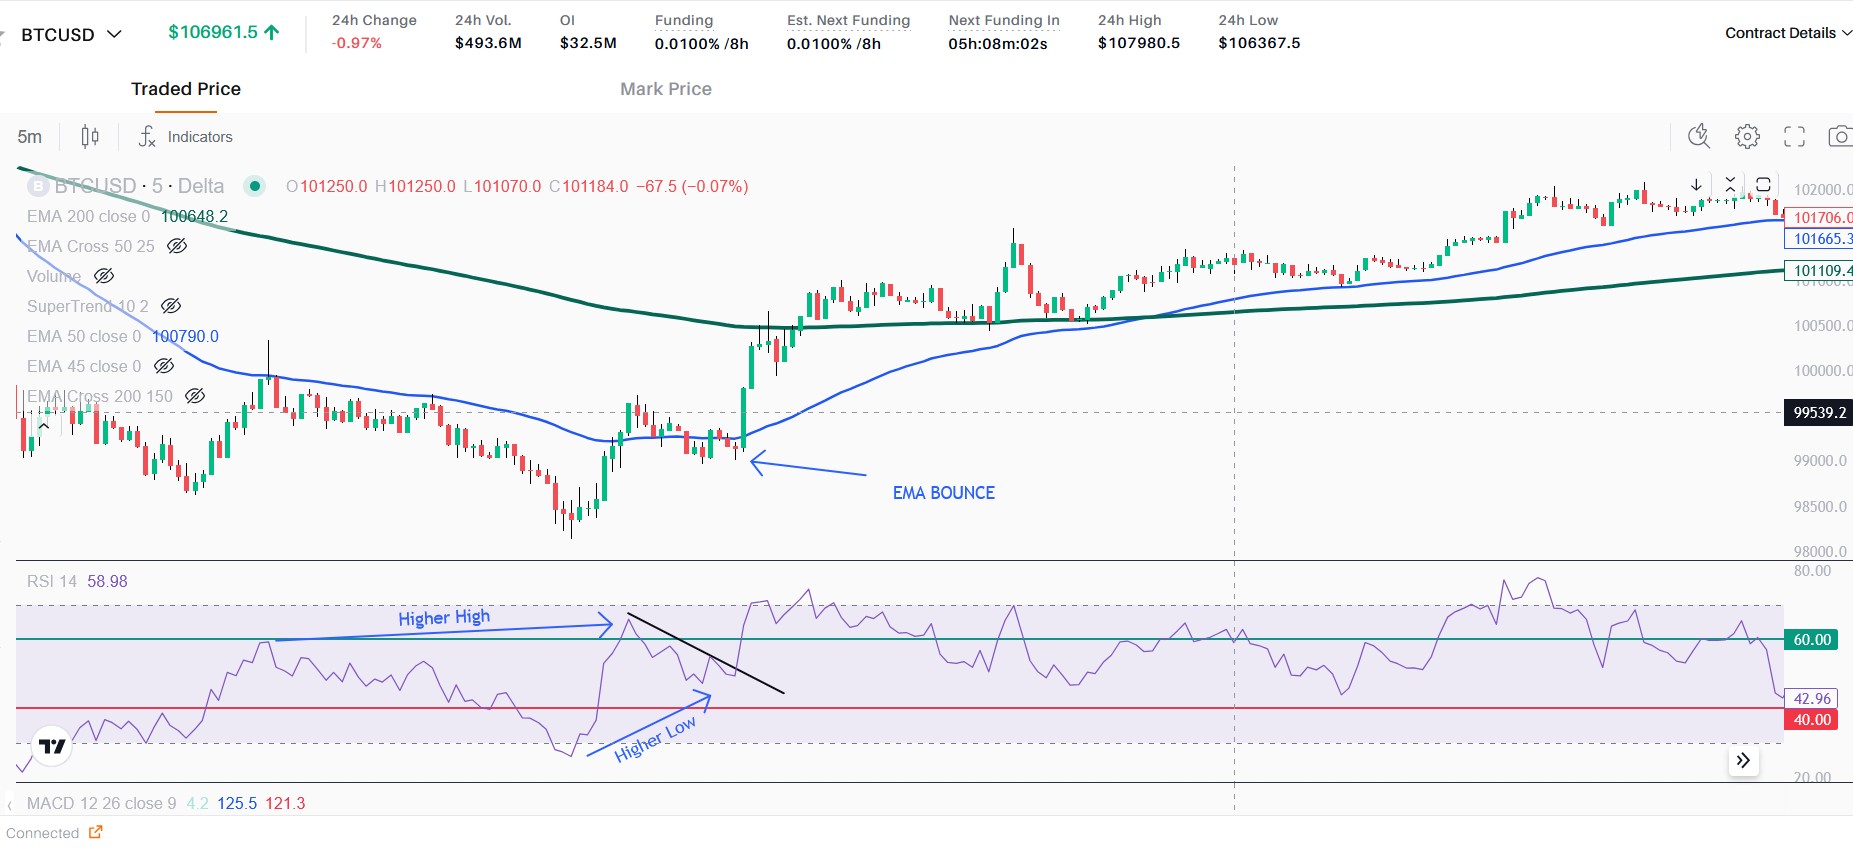
RSI MAGIC + EMA (UPTREND)
- Price should be above EMA 200 in PT
- RSI in Uptrend should exibhit Higher High and Higher Low
- RSI current High should be greater than previous High
- Map the trend with EMA and price should be above EMA
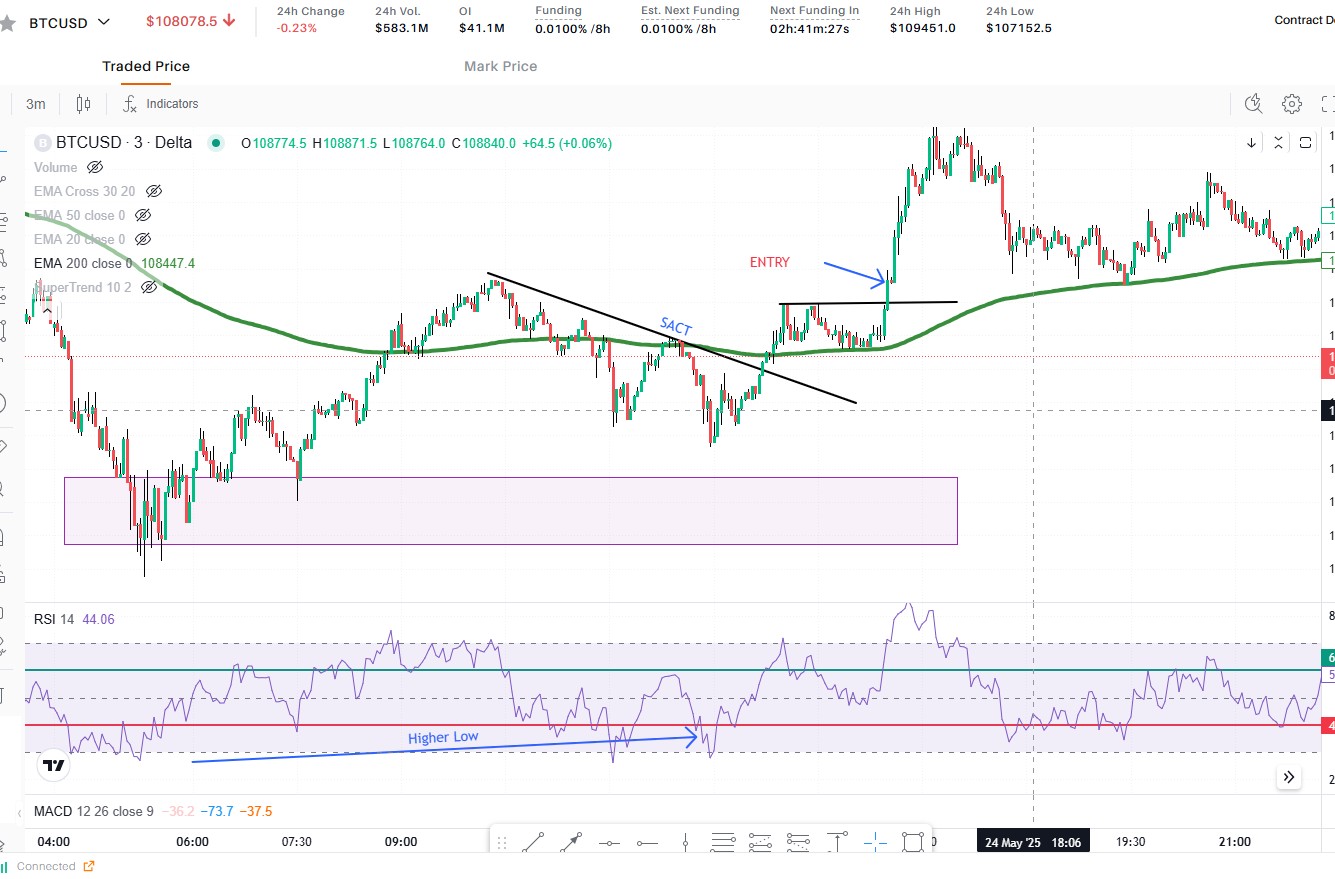
- In CT
- Look for Higher low
- Map the trend with EMA
- Look for small resistance
- Price should be above EMA
- Take Entry on Break
Example - 1
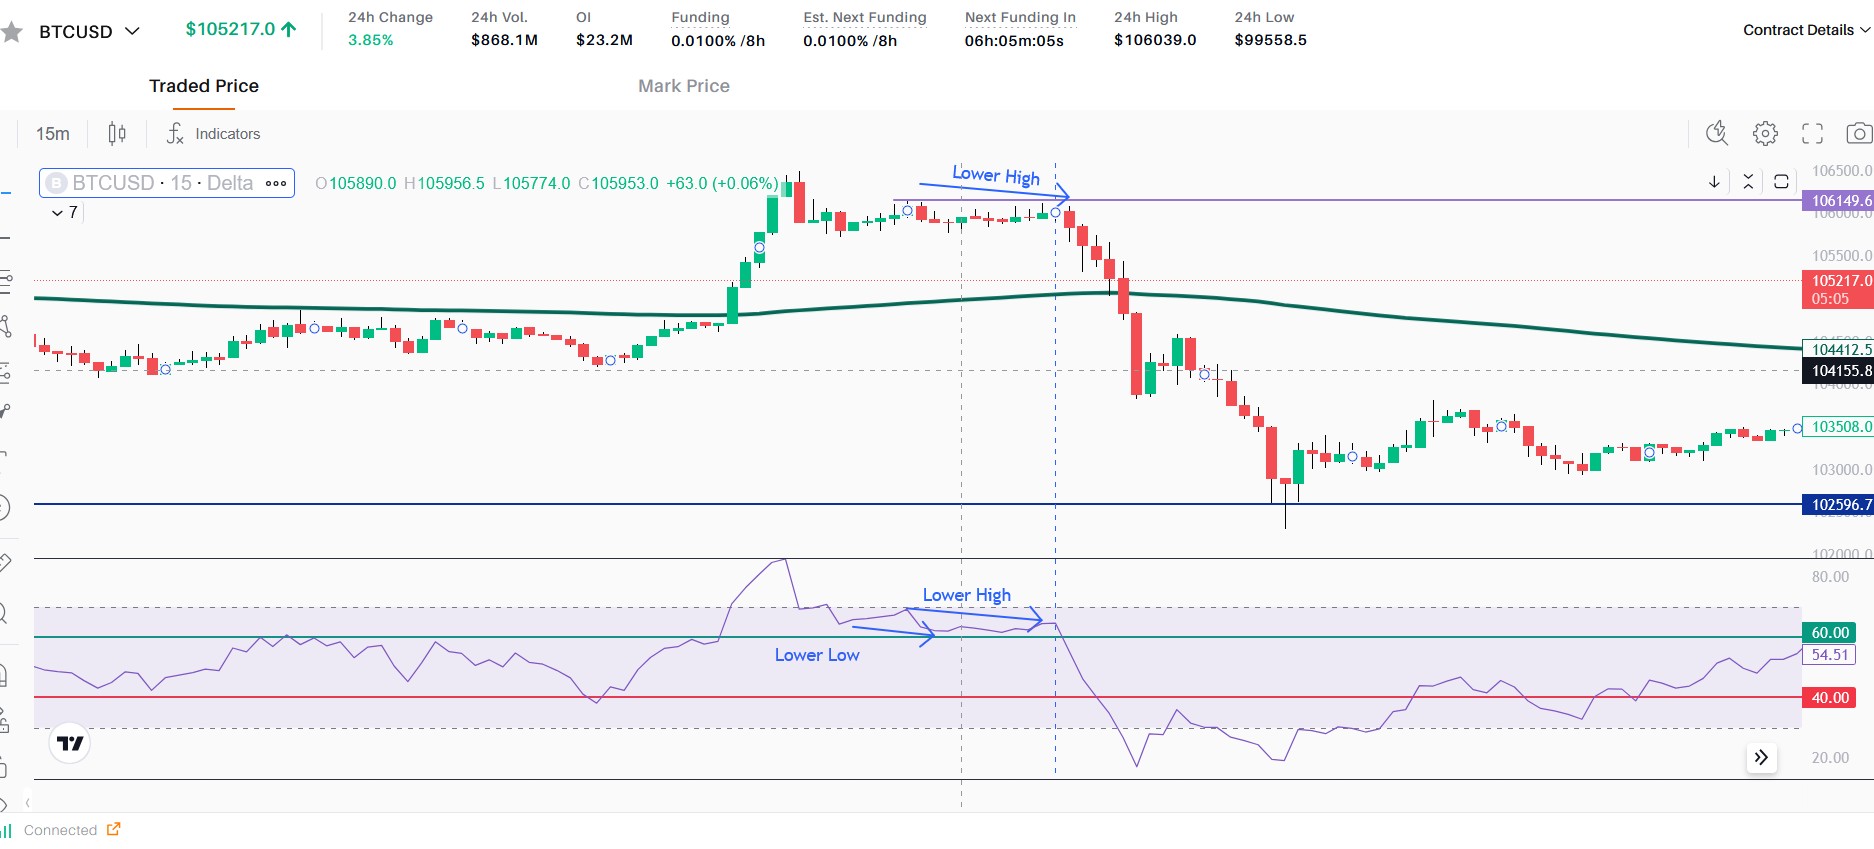
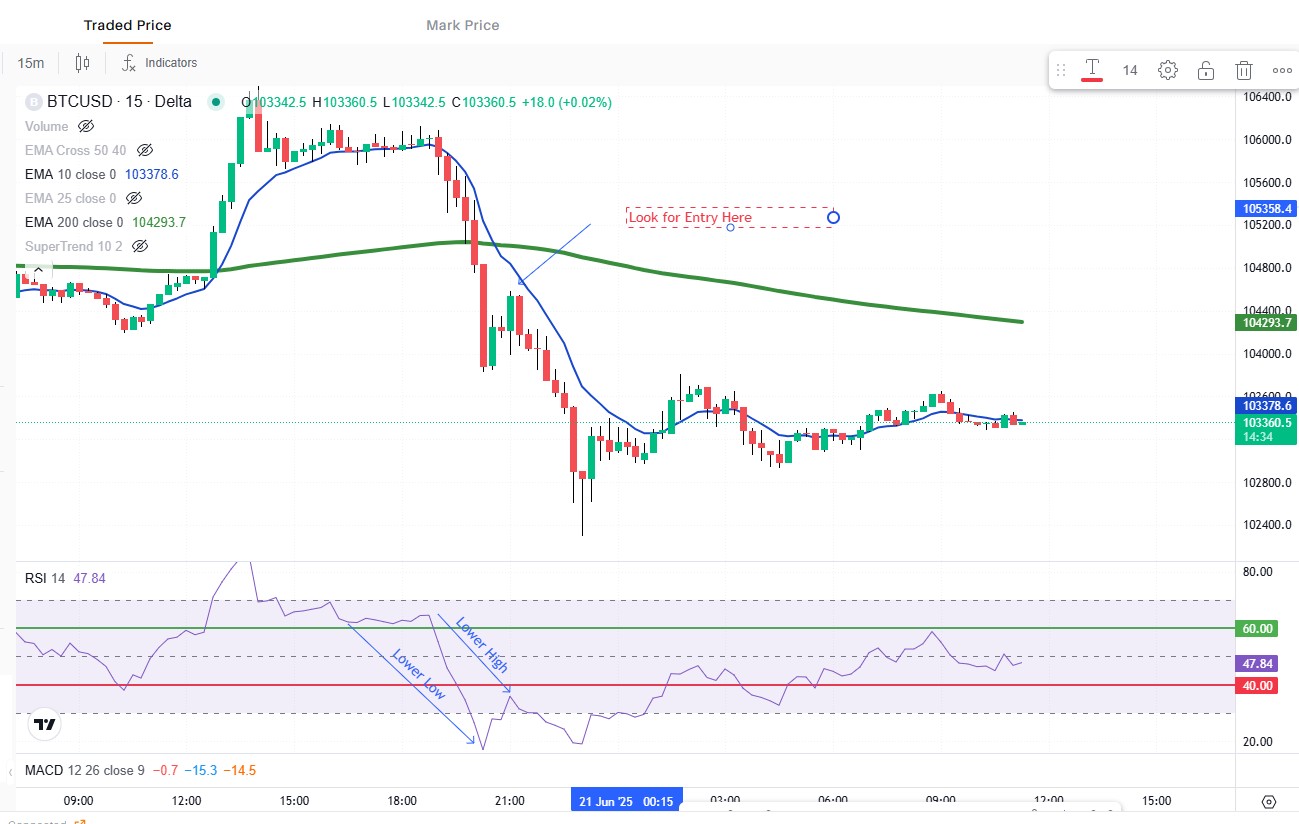
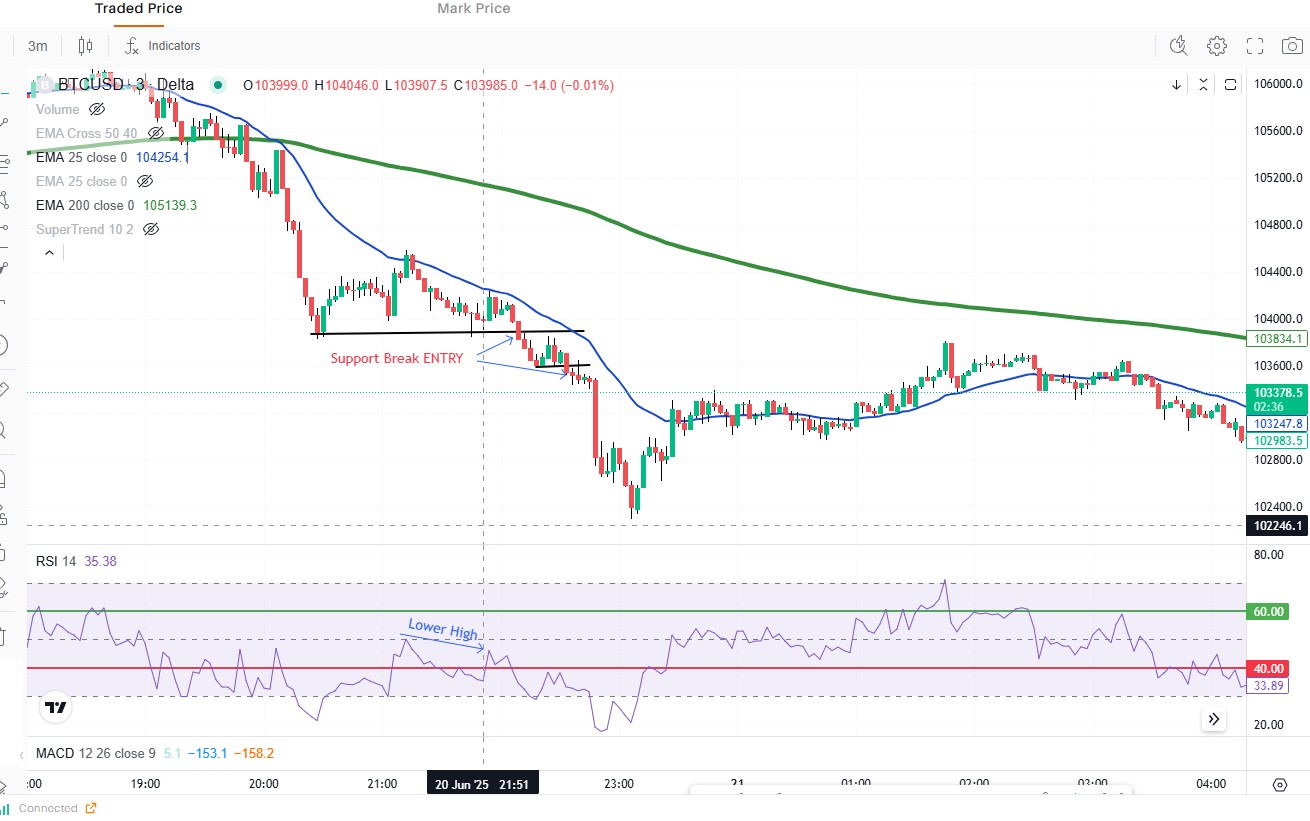
RSI MAGIC + EMA (DOWNTREND)
- Price should be below EMA 200 in PT
- RSI in Downtrend should exibhit Lower High and Lower Low
- RSI current High should lower than previous High
- Map the trend with EMA and price should be below EMA
- In CT
- Look for Higher low
- Map the trend with EMA
- Look for small resistance
- Price should be below EMA
- Take Entry on Break
Example - 1
Example - 2
Divergence + Volume
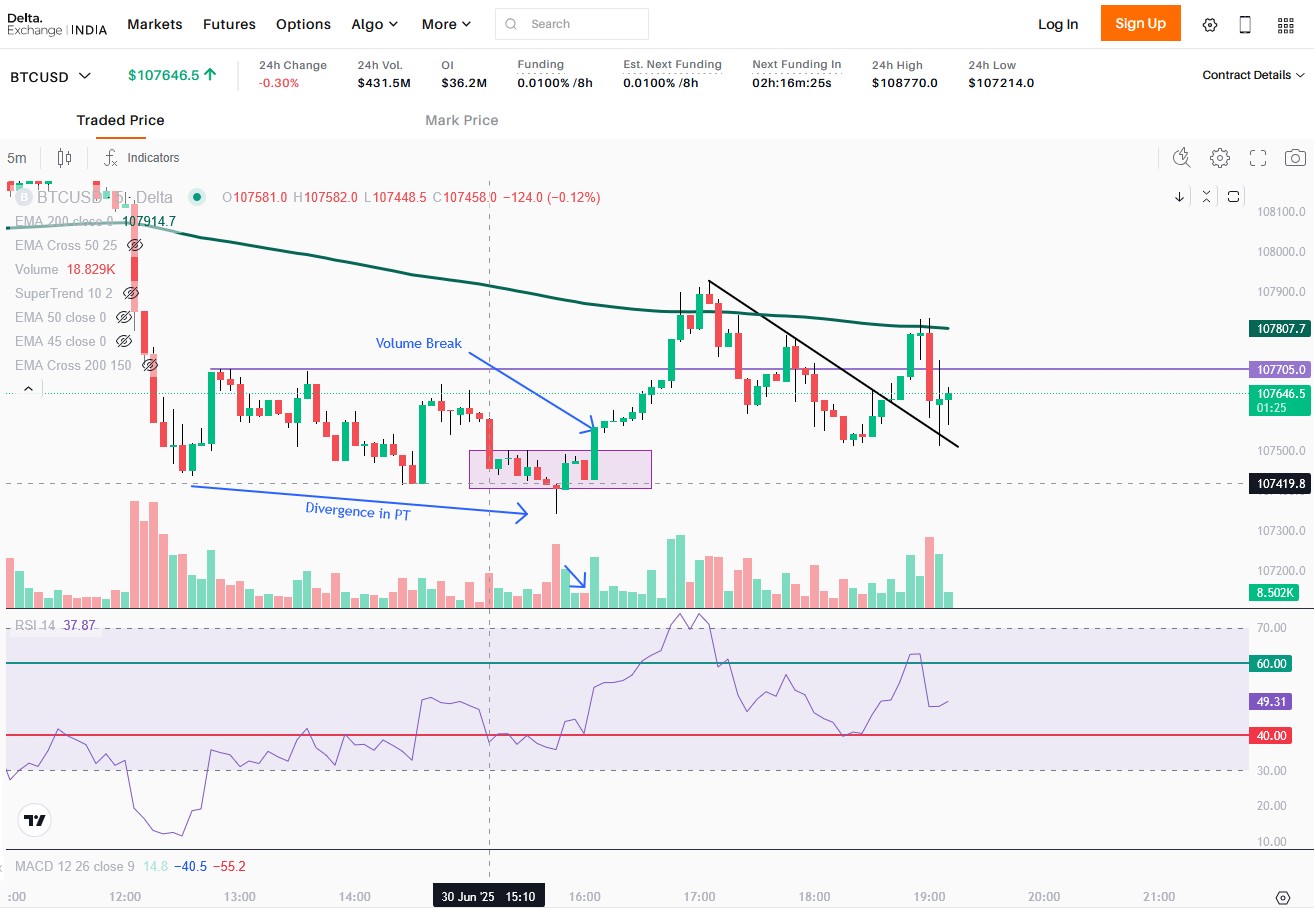
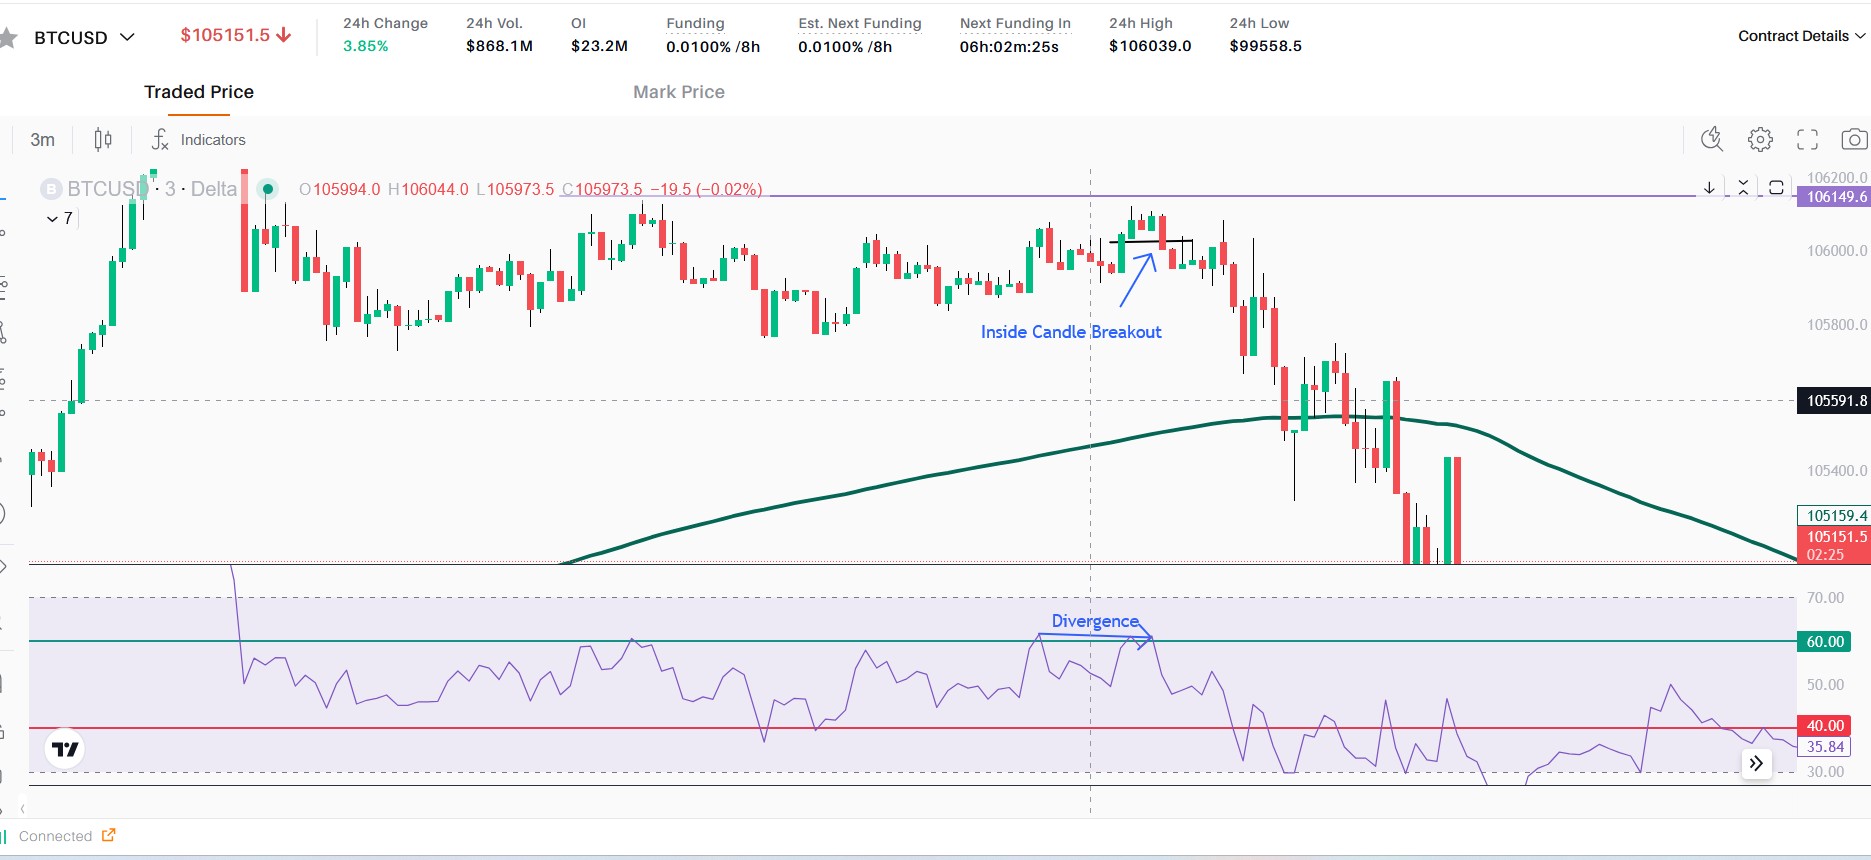
RSI MAGIC + Divergence in CT (UPTREND)
- Price should be above EMA 200 in PT
- RSI in PT should be above 40 and taking support
- In CT
- RSI below 40
- Look for divergence