Bounce on Support and Resistnace
Uptrend - Bounce on Support
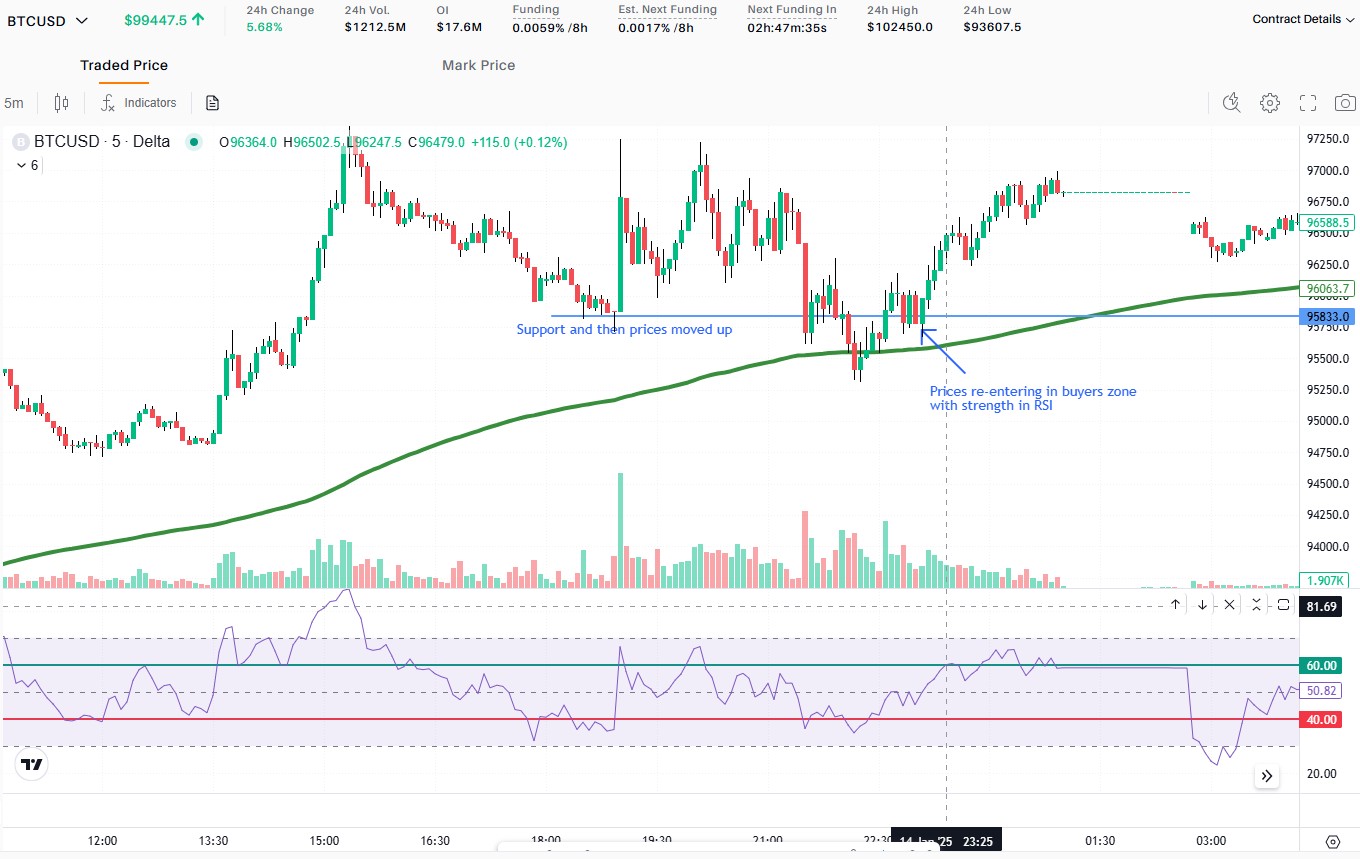
- Prices are above EMA 200 in PT
- Prices retrace and create a support
- Support is created
- Prices stops creating lower low and moves up
- Prices touching the same level twice or more
- Draw Support line
- Prices moves above the support line
- RSI exhibits strength

Uptrend - Bounce on Resistance - First Cycle
- Prices are above EMA 200 in CT, In PT below EMA 200
- Prices break significant Resistance and first cycle is created
- Prices go below significant resistance
- RSI exhibits strength
